

Question: need help answering question 28 28. DETAILS BBBASICSTAT8 4.1.018.MI. time left.MY NOTES Do larger universities tend to have more property crime? University crime statistics are
need help answering question 28
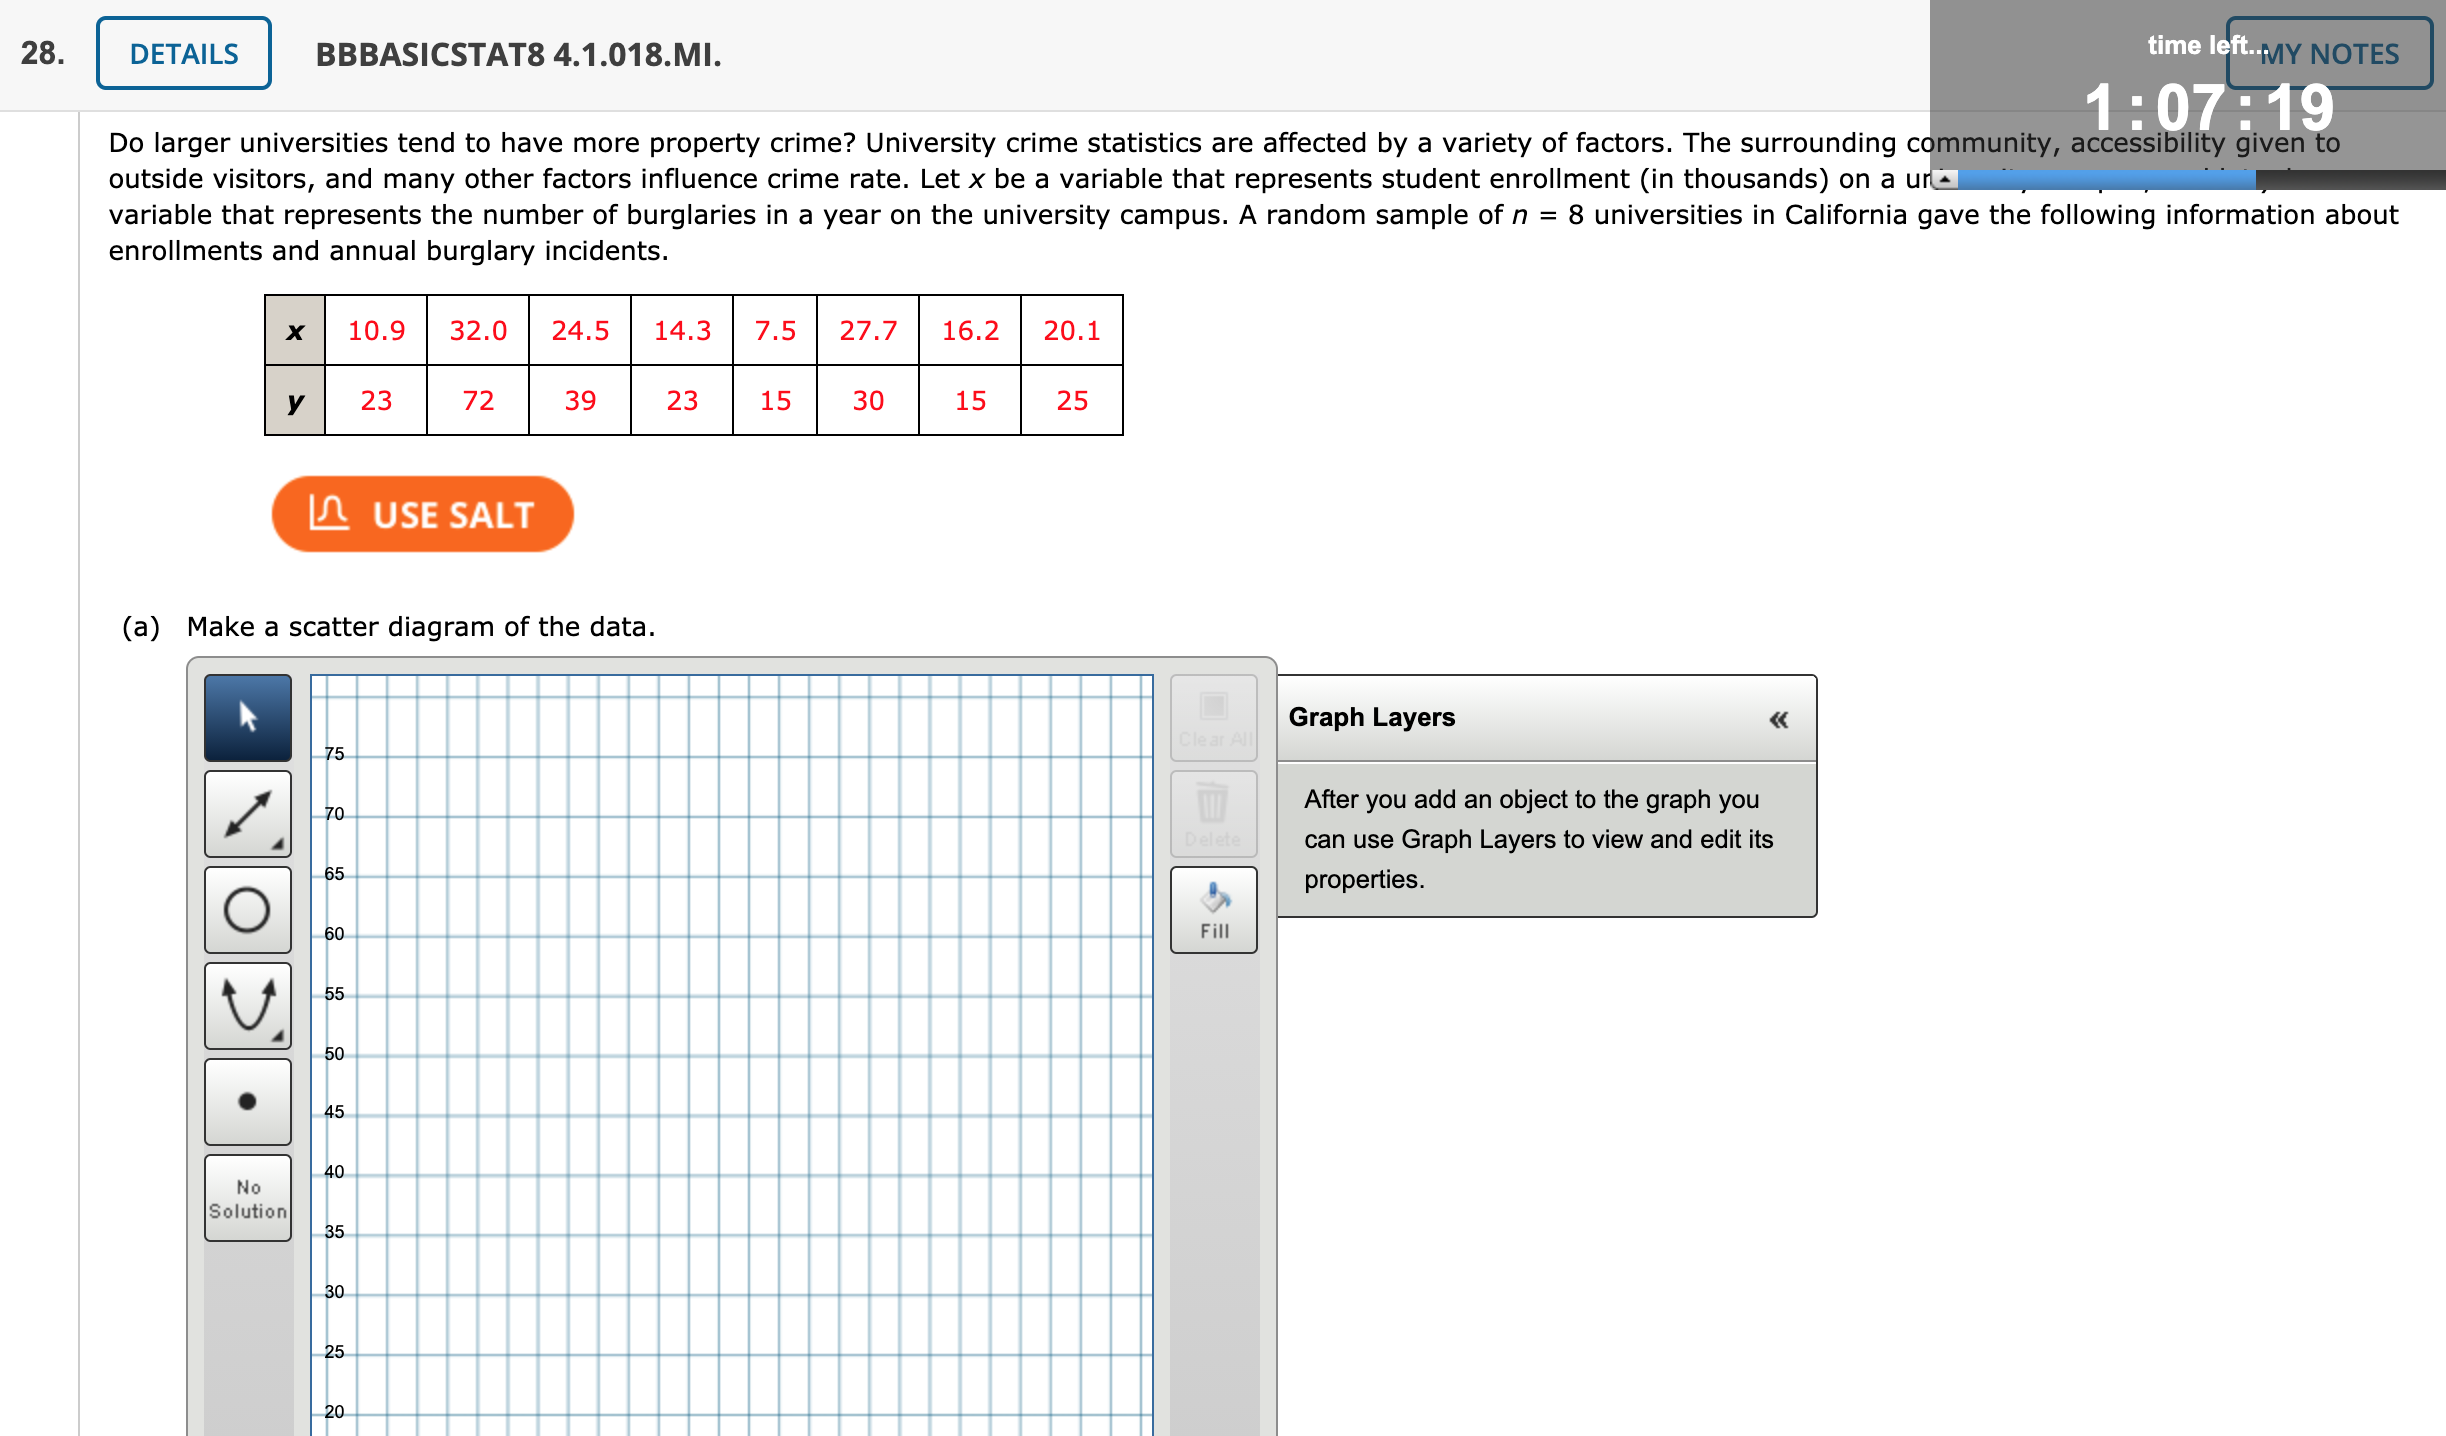
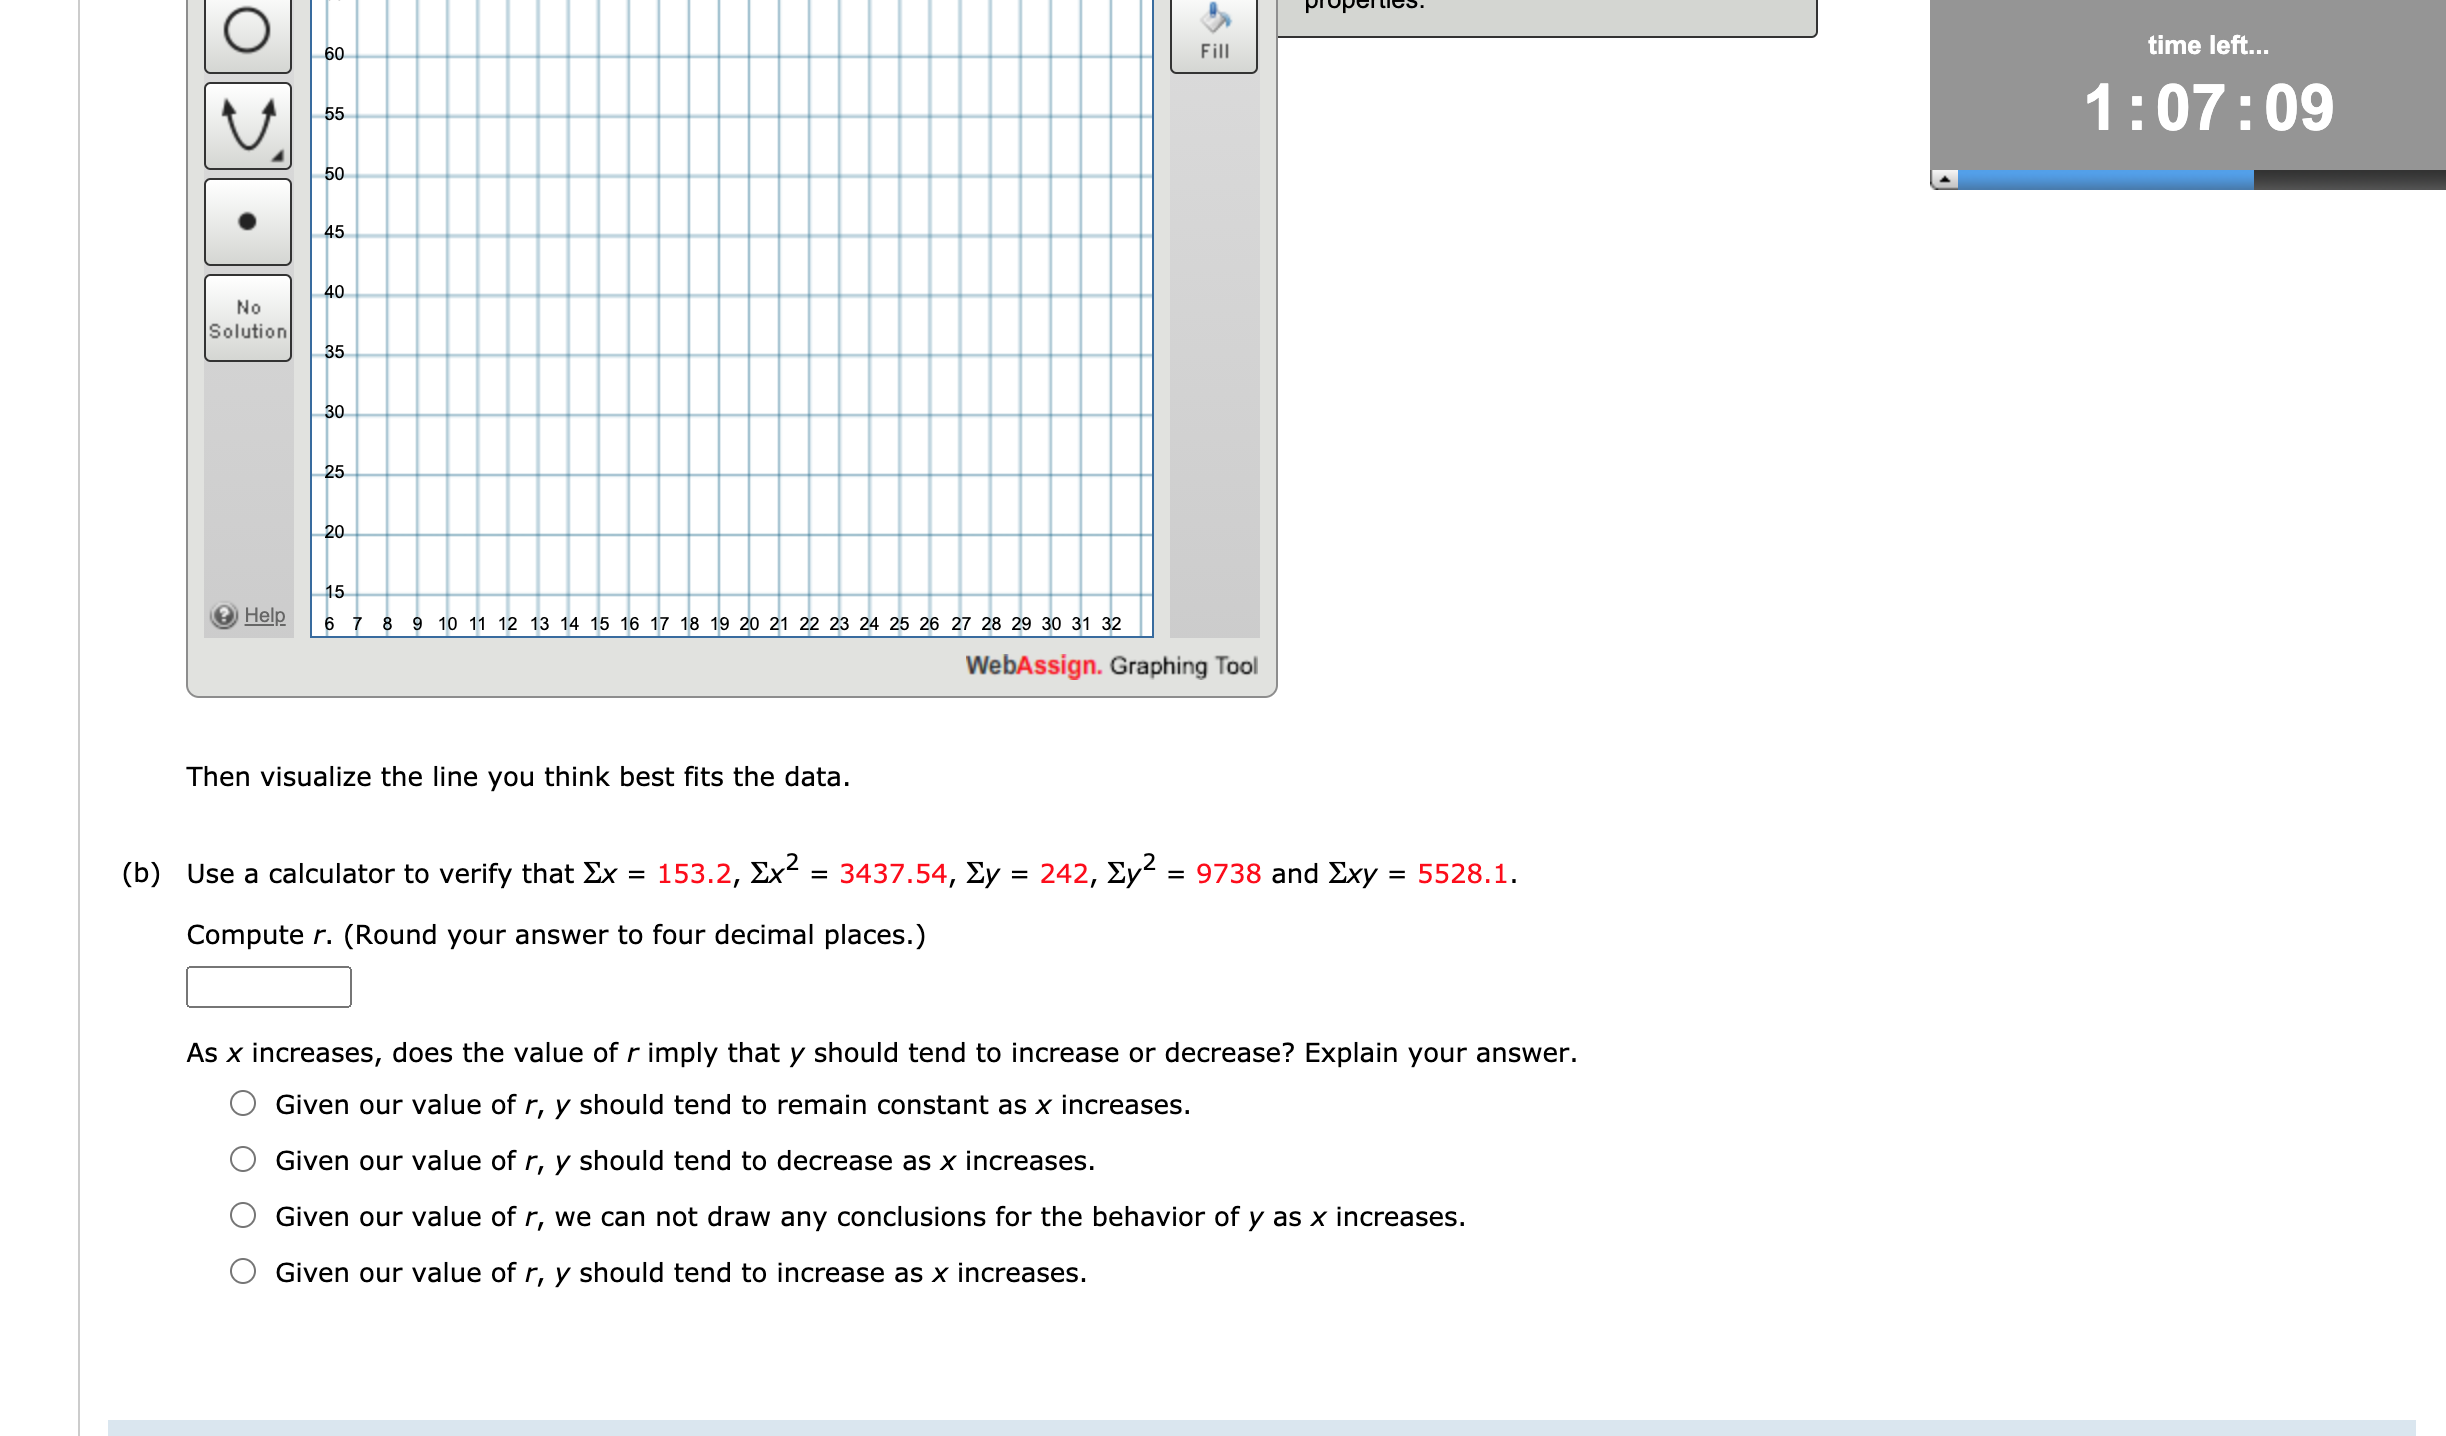
28. DETAILS BBBASICSTAT8 4.1.018.MI. time left.MY NOTES Do larger universities tend to have more property crime? University crime statistics are affected by a variety of factors. The surrounding community, accessibility given to 1:07 : 19 outside visitors, and many other factors influence crime rate. Let x be a variable that represents student enrollment (in thousands) on a ura variable that represents the number of burglaries in a year on the university campus. A random sample of n = 8 universities in California gave the following information about enrollments and annual burglary incidents. X 10.9 32.0 24.5 14.3 7.5 27.7 16.2 20.1 y 23 72 39 23 15 30 15 25 USE SALT (a) Make a scatter diagram of the data. Graph Layers 75 70 After you add an object to the graph you can use Graph Layers to view and edit its 65 O properties. 60 Fill 55 50 45 40 No Solution 35 30 25 -201 : 07 {"09 M: '1 lm\" (b) Use a calculator to verify that 2x = 153.2, 2x2 = 3437.54, 2y = 242, 2y2 = 9738 and 2xy = 5528.1. Then visualize the line you think best ts the data. Compute r. (Round your answer to four decimal places.) I:] As x increases, does the value of r imply that y should tend to increase or decrease? Explain your answer. 0 Given our value of r, y should tend to remain constant as x increases. 0 Given our value of r, y should tend to decrease as X increases. 0 Given our value of r, we can not draw any conclusions for the behavior of y as x increases. 0 Given our value of r, y should tend to increase as X increases
Step by Step Solution
There are 3 Steps involved in it

Get step-by-step solutions from verified subject matter experts