

Question: Need help answering QUESTION 8 A sample from a normally distributed population yields the following statistics: 5 = 26.8,3 = 4.3,n = 27 The 97.5th
Need help answering
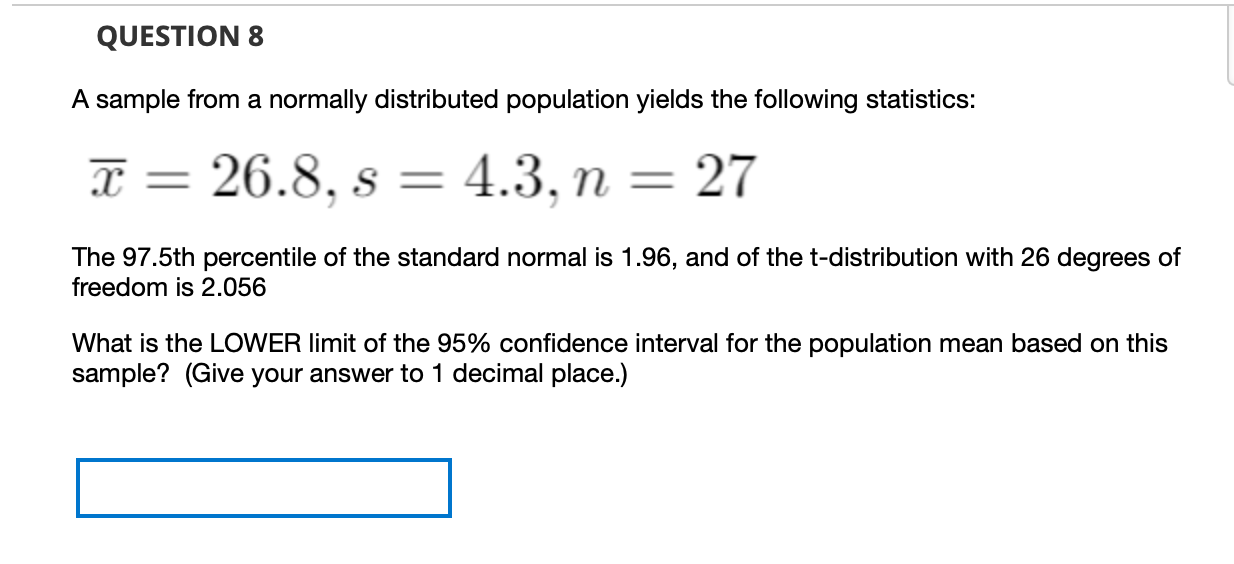
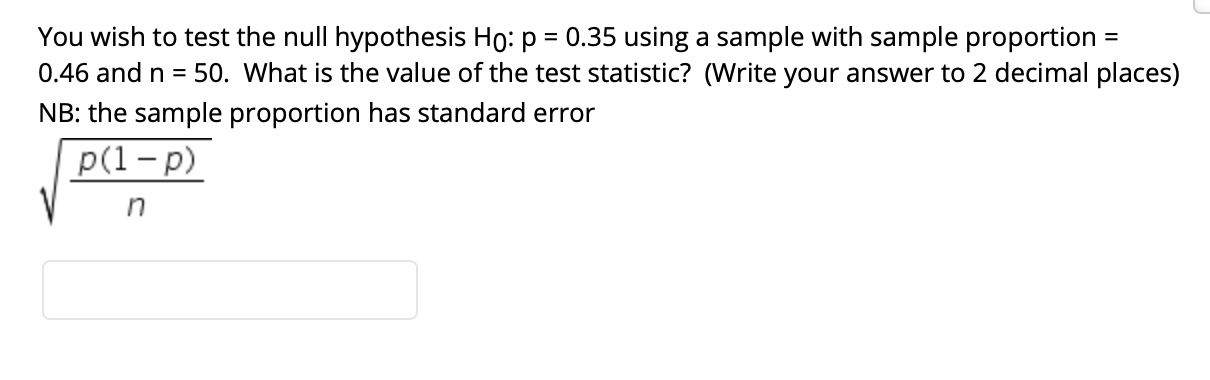
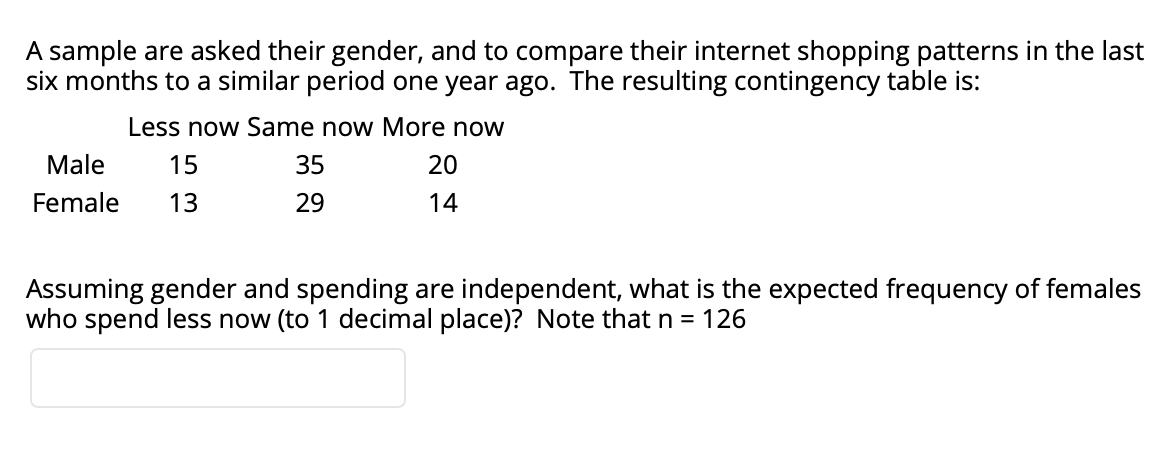
QUESTION 8 A sample from a normally distributed population yields the following statistics: 5 = 26.8,3 = 4.3,n = 27 The 97.5th percentile of the standard normal is 1.96, and of the t-distribution with 26 degrees of freedom is 2.056 What is the LOWER limit of the 95% confidence interval for the population mean based on this sample? (Give your answer to 1 decimal place.) |:| You wish to test the null hypothesis H0: p = 0.35 using a sample with sample proportion = 0.46 and n = 50. What is the value of the test statistic? (Write your answer to 2 decimal places) NB: the sample proportion has standard error P(l-p) n A sample are asked their gender, and to compare their internet shopping patterns in the last six months to a similar period one year ago. The resulting contingency table is: Less now Same now More now Male 15 35 20 Female 13 29 14 Assuming gender and spending are independent, what is the expected frequency offemales who spend less now (to 1 decimal place)? Note that n = 126
Step by Step Solution
There are 3 Steps involved in it

Get step-by-step solutions from verified subject matter experts