

Question: Need help answering this I've provided both the graphs referenced. A leverage ratio is any one of several financial measurements that look at how much
Need help answering this I've provided both the graphs referenced.
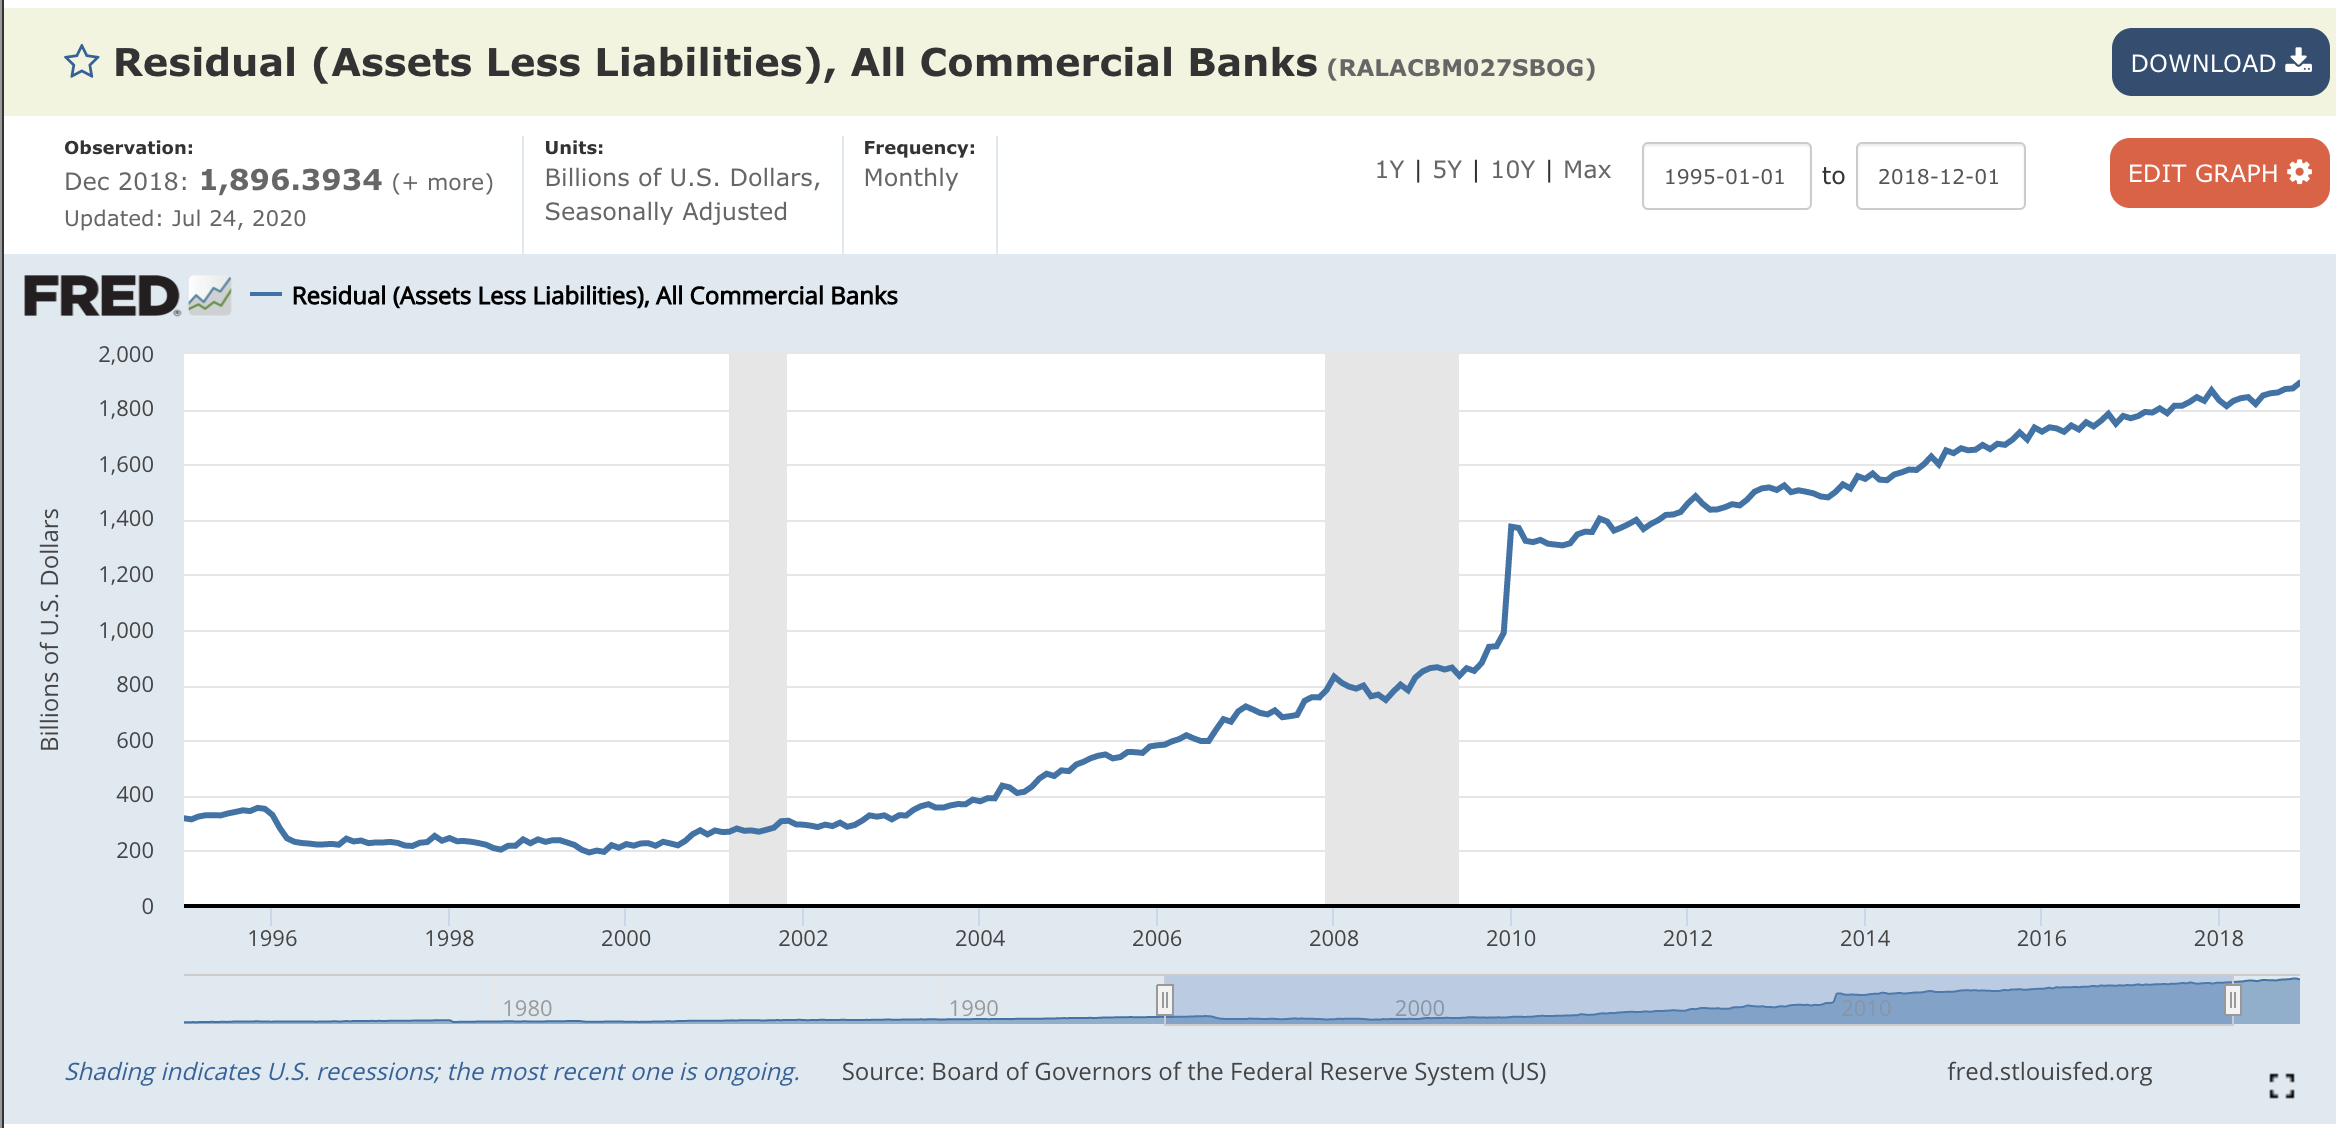
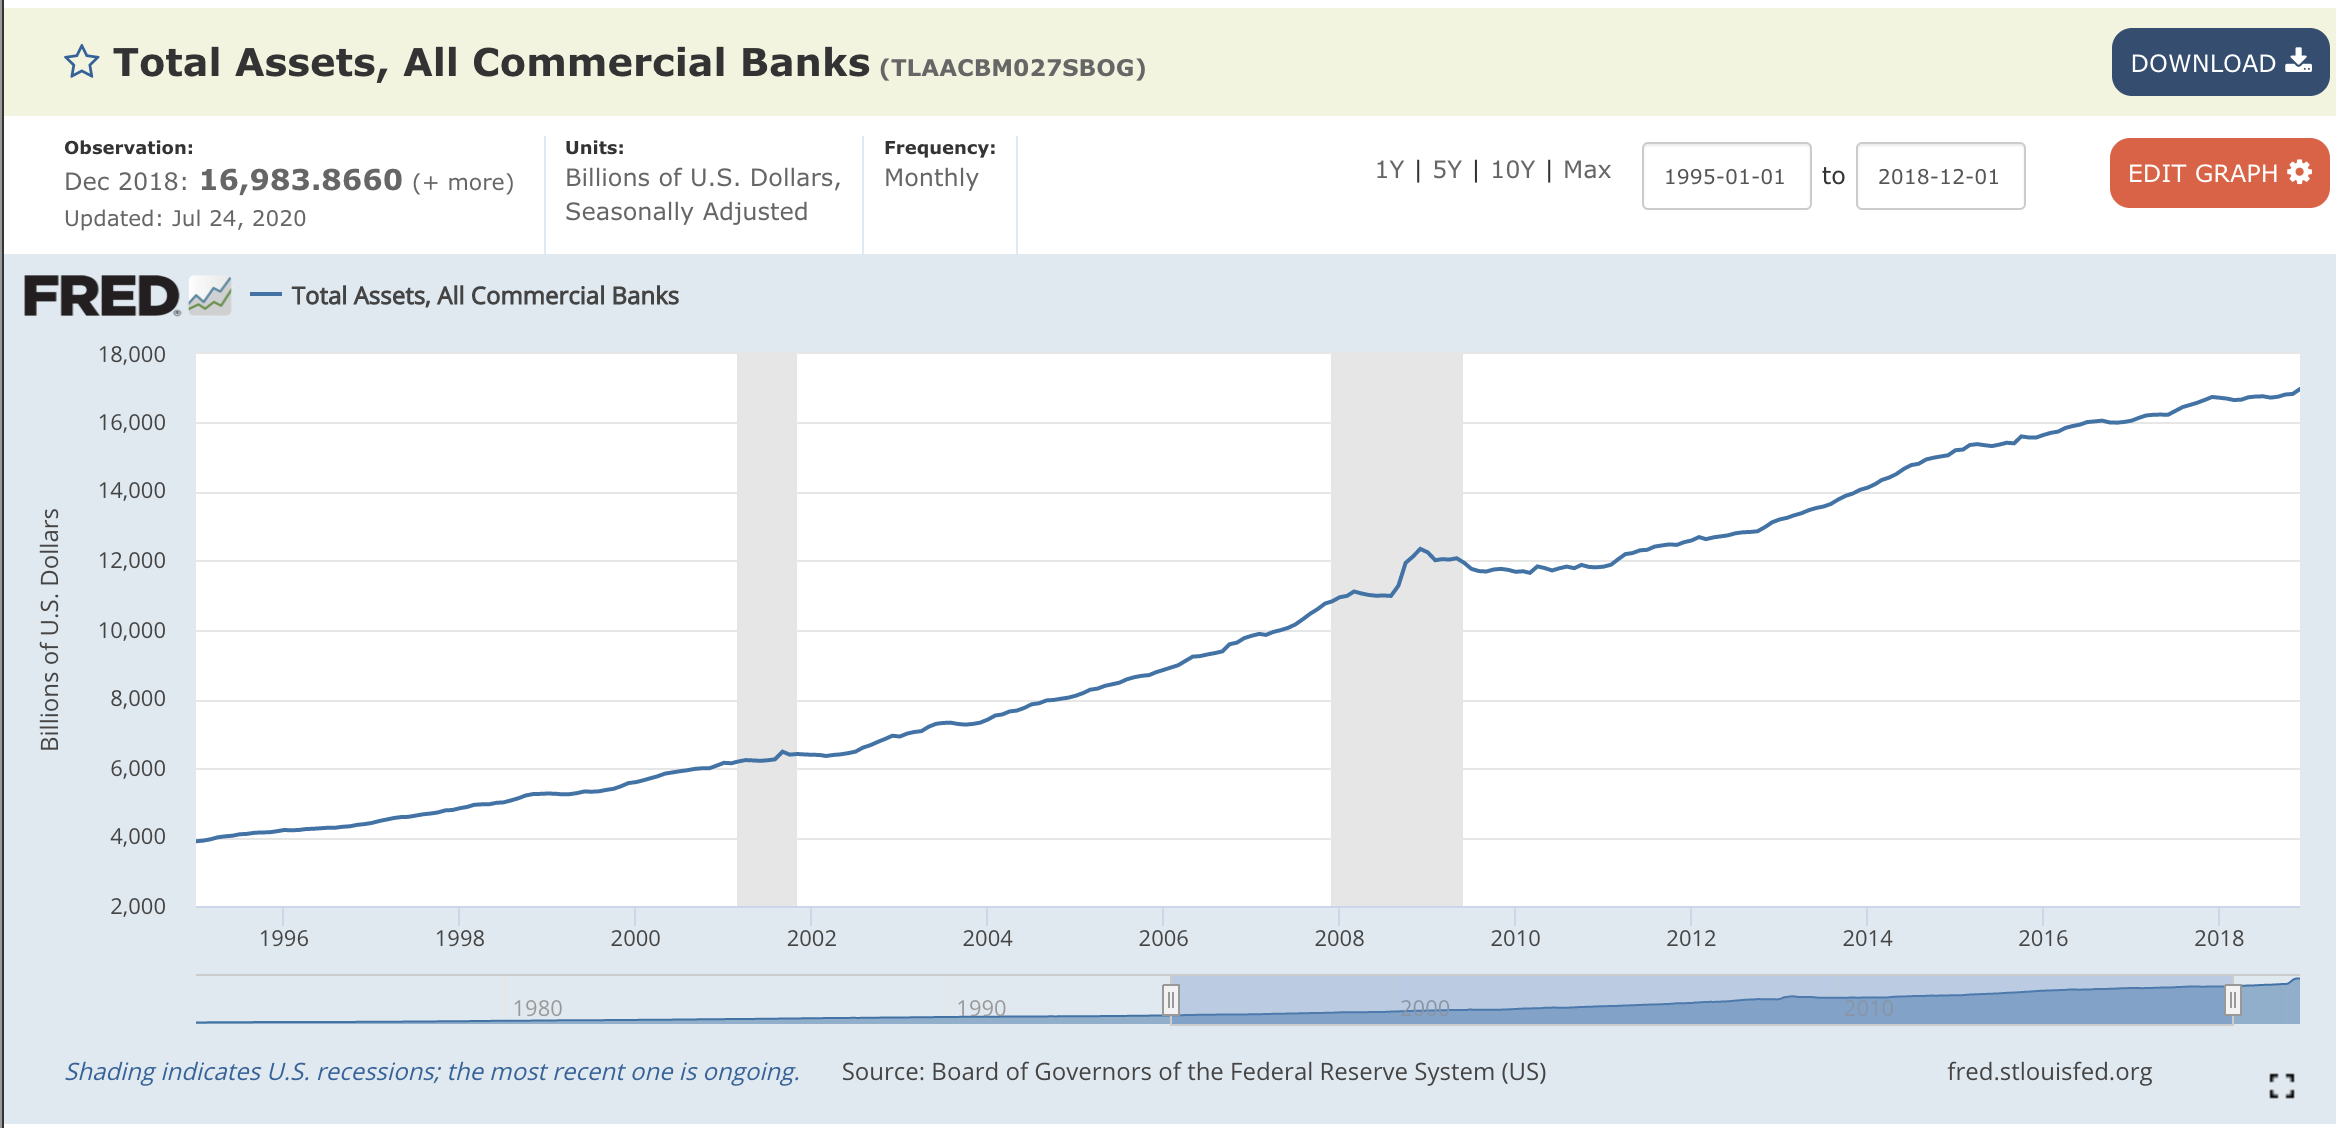
A leverage ratio is any one of several financial measurements that look at how much capital a firm holds in relation to its total assets. For our purposes we define the bank's leverage ratio as equity capital divided by total assets.* Go to the St. Louis Federal Reserve FRED database, and find data on assets less liabilities, i.e. bank capital (RALACBMO27SBOG), and total assets of commercial banks(TLAACBM027SBOG). Starting in January 1995 until December 2018, calculate the bank leverage ratio and create a line graph of the leverage ratio over this sample (include the graph you created with your submission). Given the path of bank leverage over time, what can you conclude about moral hazard in the banking system over the time period considered? * - Just to show how nebulous is the definition of the leverage ratio, the inverse of this ratio is also called a leverage ratio in other contexts.w Residual (Assets Less Liabilities), All Commercial Banks (RALACBM027SBOG) DOWNLOAD. Observation: Units: Frequency: Dec 2018: 1,896.3934 (+ more) Billions of U.S. Dollars, Monthly 1Y | 5Y | 10Y | Max 1995-01-01 to 2018-12-01 EDIT GRAPH Updated: Jul 24, 2020 Seasonally Adjusted FRED ~ - Residual (Assets Less Liabilities), All Commercial Banks 2,000 1,800 1,600 Billions of U.S. Dollars 1,400 1,200 1,000 800 600 400 200 0 1996 1998 2000 2002 2004 2006 2008 2010 2012 2014 2016 2018 1980 1990 2000 Shading indicates U.S. recessions; the most recent one is ongoing. Source: Board of Governors of the Federal Reserve System (US) fred.stlouisfed.orgw Total Assets, All Commercial Banks (TLAACBM027SBOG) DOWNLOAD. Observation: Units: Frequency: Dec 2018: 16,983.8660 (+ more) Billions of U.S. Dollars, Monthly 1Y | 5Y | 10Y | Max 1995-01-01 to 2018-12-01 EDIT GRAPH Updated: Jul 24, 2020 Seasonally Adjusted FRED ~ - Total Assets, All Commercial Banks 18,000 16,000 14,000 Billions of U.S. Dollars 12,000 10,000 8,000 6,000 4,000 2,000 1996 1998 2000 2002 2004 2006 2008 2010 2012 2014 2016 2018 1980 1990 2000 Shading indicates U.S. recessions; the most recent one is ongoing. Source: Board of Governors of the Federal Reserve System (US) fred.stlouisfed.org
Step by Step Solution
There are 3 Steps involved in it

Get step-by-step solutions from verified subject matter experts