Question: NEED help asap! Need thorough calculations for questions with steps that explain the problem. Questions are down below. OVERVIEW Barb Williams and Steven Lau, two
NEED help asap! Need thorough calculations for questions with steps that explain the problem. Questions are down below.
OVERVIEW
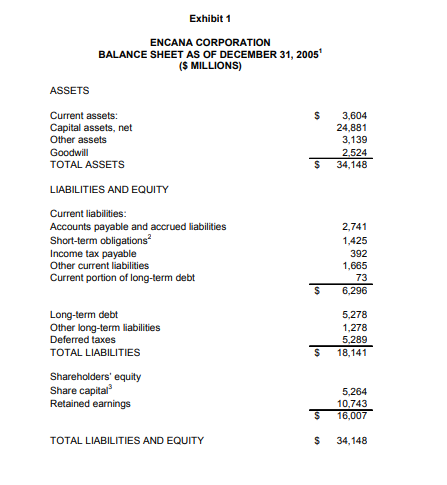
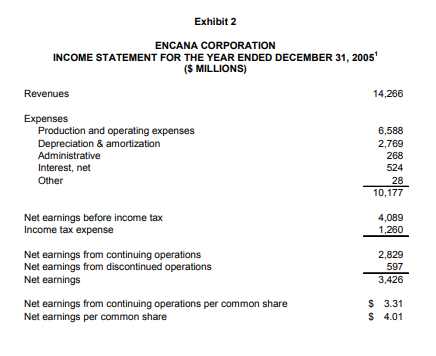
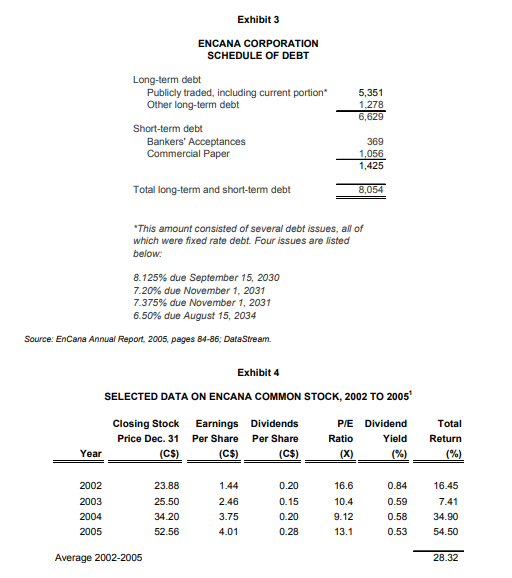
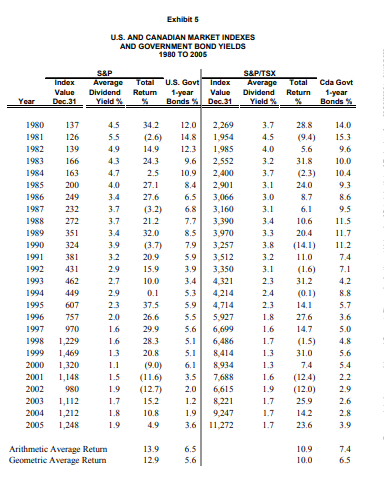
Barb Williams and Steven Lau, two managers from service firms, were attending a week-long executive education course at a well-known business school in February 2006. In preparation for the next day's classroom session, both had read an article dealing with the cost of capital. As they vigorously discussed the concept, it became clear they had several differences of opinion. Their assignment was to calculate the cost of capital for EnCana Corporation (EnCana). EnCana was a leading oil and gas producer in North America focusing on developing 'resource plays'1 and the in situ recovery of oilsands bitumen. The data they gathered are presented in Exhibits 1 to 5.
EnCana was created in 2002 through the merger of Pan Canadian Energy Corporation and Alberta Energy Company. The focus of the newly amalgamated company was on the discovery and development of oil and gas fields and on selling the corporation's proprietary production of natural gas, crude oil, and natural gas liquids in the wholesale market to commodity purchasers with superior financial credit ratings. The company was among the largest holders of oil and natural gas resource lands in North America and prided itself in the fact that its holdings had a lower geological and/or commercial development risk and lower average decline rate than that of its competitors. Approximately 80 percent of the operating cash flow came from natural gas. The company's oilsands growth profile was one of the most aggressive in North America, with an additional 500 MBD2 of oilsands bitumen production expected by 2015.
Steven: What we really want to know is the hurdle rate that EnCana should use for its capital investment projects.
Barb: Yes, and we should decide whether the rate ought to be different for different types of projects, such as exploration and drilling, or oil production from oilsands.
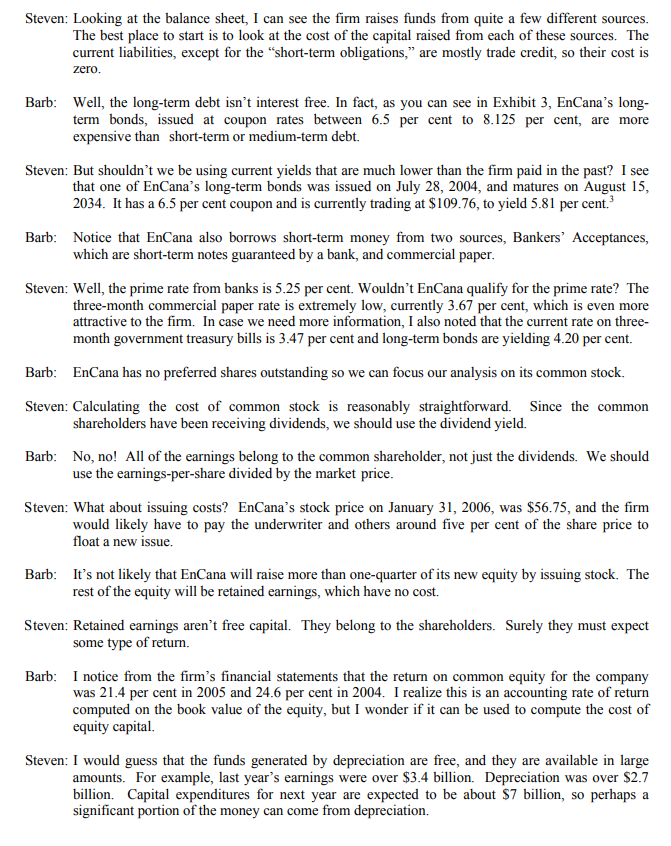
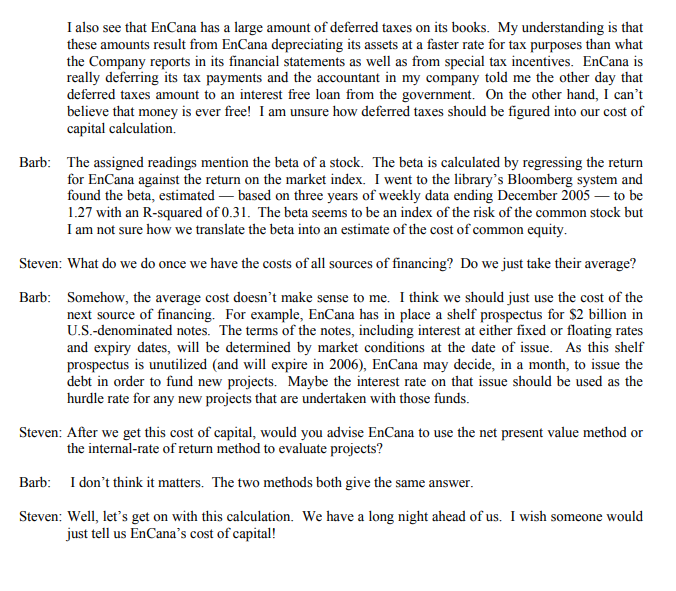
Exhibit 1 ENCANA CORPORATION BALANCE SHEET AS OF DECEMBER 31, 20051 ($ MILLIONS) ASSETS Current assets: S 3,604 Capital assets, net 24,881 Other assets 3,139 Goodwill 2.524 TOTAL ASSETS 34,148 LIABILITIES AND EQUITY Current liabilities: Accounts payable and accrued liabilities 2,741 Short-term obligations' 1,425 Income tax payable 392 Other current liabilities 1,665 Current portion of long-term debt 73 S 6,296 Long-term debt 5.278 Other long-term liabilities 1,278 Deferred taxes 5,289 TOTAL LIABILITIES S 18,141 Shareholders' equity Share capital 5.264 Retained earnings 10,743 5 16,007 TOTAL LIABILITIES AND EQUITY S 34, 148\fExhibit 3 ENCANA CORPORATION SCHEDULE OF DEBT Long-term debt Publicly traded, including current portion" 5,351 Other long-term debt 1,278 6,629 Short-term debt Bankers' Acceptances 369 Commercial Paper 1,056 1,425 Total long-term and short-term debt 8,054 "This amount consisted of several debt issues, all of which were fixed rate debt. Four issues are listed below 8.125% due September 15, 2030 7.20% due November 1, 2031 7.375% due November 1, 2031 6.50%% due August 15, 2034 Source: EnCana Annual Report, 2005, pages 84-86: DataStream. Exhibit 4 SELECTED DATA ON ENCANA COMMON STOCK, 2002 TO 2005 Closing Stock Earnings Dividends P/E Dividend Total Price Dec. 31 Per Share Per Share Ratio Yield Return Year (C$) (C$) (X) () (%) 2002 23.88 1.44 0.20 16.6 0.84 16.45 2003 25.50 2.46 0.15 10.4 0.59 7.41 2004 34.20 3.75 0.20 9.12 0.58 34.90 2005 52.56 4.01 0.28 13.1 0.53 54.50 Average 2002-2005 28.32Exhibit $ US. AND CANADIAN MARKET INDEXES AND GOVERNMENT BOND YIELDS 1880 TO 2006 SAPTSX Index Average Total U.S. Govt Index Avorage Total Cda Govt Value Dividend Return 1-year Value Dividend Return 1-year Year Doc.31 Yield %% Bonds % Doc.31 Yield %% Bonds % 1980 137 45 34.2 12.0 2,269 3.7 28.8 14.0 1981 126 5.5 (2.6) 14.8 1,954 4.5 (9.4) 15.3 1982 139 4.9 14.9 12.3 1,985 4.0 5.6 9.6 1983 166 43 24.3 9.6 2,552 3.2 31.8 10 0 1984 163 4.7 2.5 10.9 2,40 0 3.7 (2.3) 10.4 1985 200 4.0 27.1 2,901 3.1 24.0 4.3 1986 249 3.4 27.6 6.5 3,066 3.0 8.7 8.6 1987 212 3.7 (3.4) 6.8 3,160 3.1 6.1 9.5 1988 272 3.7 21.2 3,390 3.4 10.6 11.5 1989 351 3.4 32.0 8.5 3,970 3.3 20.4 11.7 1990 324 3.9 (3.7) 7.9 3,257 3.8 (14.1) 11.2 1991 381 3.2 20.9 5.9 3,512 3.2 11.0 7.4 1992 431 2.9 15.9 3.9 3,350 3.1 (1.6) 7.1 1993 462 2.7 10.0 3.4 4,321 2.3 31.2 4.2 1994 149 0.1 5.3 4,214 2.4 (0.1) H.H 1995 607 23 37.5 5.9 4,714 2.3 14.1 5.7 1996 757 2.0 26.6 5.15 5,927 1.H 27.6 3.6 1997 970 1.6 29.9 5.6 6.699 1.6 14.7 5.0 1998 1,229 1.6 28.3 5.1 6,486 1.7 (1.5) 1999 1,469 13 20.8 5.1 8,414 1.3 31.0 5.6 2000 1,320 1.1 (9.0) 6.1 8,934 1.3 7.4 5.4 2001 1,148 1.5 (1 1.6) 3.5 7,688 1.6 (12.4) 2 2 2002 980 1.9 (12.7) 2.0 6.615 1.9 (12.0) 24 2003 1,112 15.2 1.2 8 221 1.7 25.9 2004 1,212 1.8 10.8 1.9 9,247 1.7 14.2 2.8 2005 1,248 1.9 4.9 3.6 11,272 1.7 23.6 3.9 Arithmetic Average Return 13.9 6.5 10.9 7.4 Geometric Average Return 12.9 5.6 10.0 6.5Steven: Barb: Steven: Barb: Steven: Barb: Steven: Barb: Steven: Barb: Steven: Barb: Steven: Looking at the balance sheet, I can see the rm raises funds from quite a few different sources. The best place to start is to look at the cost ofthe capital raised from each of these sources. The current liabilities, except for the \"shortterm obligations," are mostly trade credit, so their cost is zero. Well, the longterm debt isn't interest free. In fact, as you can see in Exhibit 3, EnCana's long- tenn bonds, issued at coupon rates between 6.5 per cent to S. I25 per cent, are more expensive than shorttenn or mediumterm debt. But shouldn't we be using current yields that are much lower than the rtn paid in the past? I see that one of EnE'ana's longterm bonds was issued on July 23, 2004, and matures on August 15, 2034. It has a 5.5 per cent coupon and is currently trading at $109215, to yield 5.31 per cent.3 Notice that EnCana also borrows shortterm money from two sources, Bankers' Acceptances, which are short-tenn notes guaranteed by a bank, and commercial paper. Well, the prime rate from banks is 5.25 per cent. Wouldn't EnC'ana qualify for the prime rate? The threemonth commercial paper rate is extremely low, currently 3.15? per cent, which is even more attractive to the rm. In case we need more information, I also noted that the current rate on three month government treasury bills is 3.4? per cent and long-tenn bonds are yielding 4.20 per cent. En-Cana ltas no preferred shares outstandin g so we can focus our analysis on its common stock. Calculating the cost of common stock is reasonably straightforward. Since the common shareholders have been receiving dividends, we should use the dividend yield. No, no! All of the earnings belong to the common shareholder, not just the dividends. We should use the eamingspershare divided by the market price. 1What about issuing costs? EnCana's stock price on January 3 l, 2006, was $56.25, and the rm would likely have to pay the underwriter and others around ve per cent of the share price to oat a new issue. It's not likely that EnCana will raise more than one-quarter of its new equity by issuing stock. The rest ofthe equity will be retained earnings, which have no cost. Retained earnings aren't free capital. They belong to the shareholders. Surely they must expect some type of return. I notice from the rm's nancial statements that the return on common equity for the company was 2|.4 per cent in 2005 and 24.15 per cent in 2004. I realize this is an accounting rate of return computed on the book value of the equity, but I wonder if it can be used to compute the cost of equity capital. I would guess that the funds generated by depreciation are free, and they are available in large amounts. For example, last year's earnings were over $3.4 billion. Depreciation was over 32.? billion. Capital expenditures for next year are expected to be about ST billion, so perhaps a signicant portion ofthe money can come from depreciation. Barb: Steven: Barb: Steven: Barb: Steven: I also see that EnCana has a large amount ofdeferred taxes on its books. My understanding is that these amounts result from EnCana depreciating its assets at a faster rate for tax purposes than what the Company reports in its nancial statements as well as from special tax incentives. EnCana is really deferring its tax payments and the accountant in my company told me the other day that deferred taxes amount to an interest free loan from the government. [in the other hand. [ can't believe that money is ever free! I am unsure how deferred taxes should be gured into our cost of capital calculation. The assigned readings mention the beta of a stock. The beta is calculated by regressing the return for EnC'ana against the return on the market index. [ went to the library's Bloomberg system and found the beta. estimated based on three years of weekly data ending December 2005 to be l2? with an Frisquared oflll l. The beta seems to be an index ofthe risk of the common stock but I am not sure how we translate the beta into an estimate ofthe cost ofcommon equity. 1What do we do once we have the costs of all sources of nancing? Do we just take their average? Somehow. the average cost doesn't make sense to me. [ think we should just use the cost of the next source of nancing. For example, lintSana has in place a shelf prospectus for SE billion in [LSdenominated notes. The terms ofthe notes. including interest at either xed or oating rates and expiry dates. will be determined by market conditions at the date of issue. As this shelf prospectus is unutilized [and will expire in 2006}. EnCana may decide. in a month. to issue the debt in order to fund new projects. Maybe the interest rate on that issue should be used as the hurdle rate for any new projects that are undertaken with those funds. Alter we get this cost of capital, would you advise EnC'ana to use the net present value method or the intemalrate of return method to evaluate projects?l 1 don't think it matters. The two methods both give the same answer. Well. let's get on with this calculation. We have a long night ahead of us. 1 wish someone would just tell us EnCana's cost ofcapital
Step by Step Solution
There are 3 Steps involved in it
1 Expert Approved Answer
Step: 1 Unlock
Question Has Been Solved by an Expert!
Get step-by-step solutions from verified subject matter experts
Step: 2 Unlock
Step: 3 Unlock
Students Have Also Explored These Related Finance Questions!