

Question: ( NEED HELP AT THIS ASAP, TWO TABLES. THE ONE IN EXCEL I JUST NEED THE COLORS PAERT ) Base your analysis on the information
NEED HELP AT THIS ASAP, TWO TABLES. THE ONE IN EXCEL I JUST NEED THE COLORS PAERT
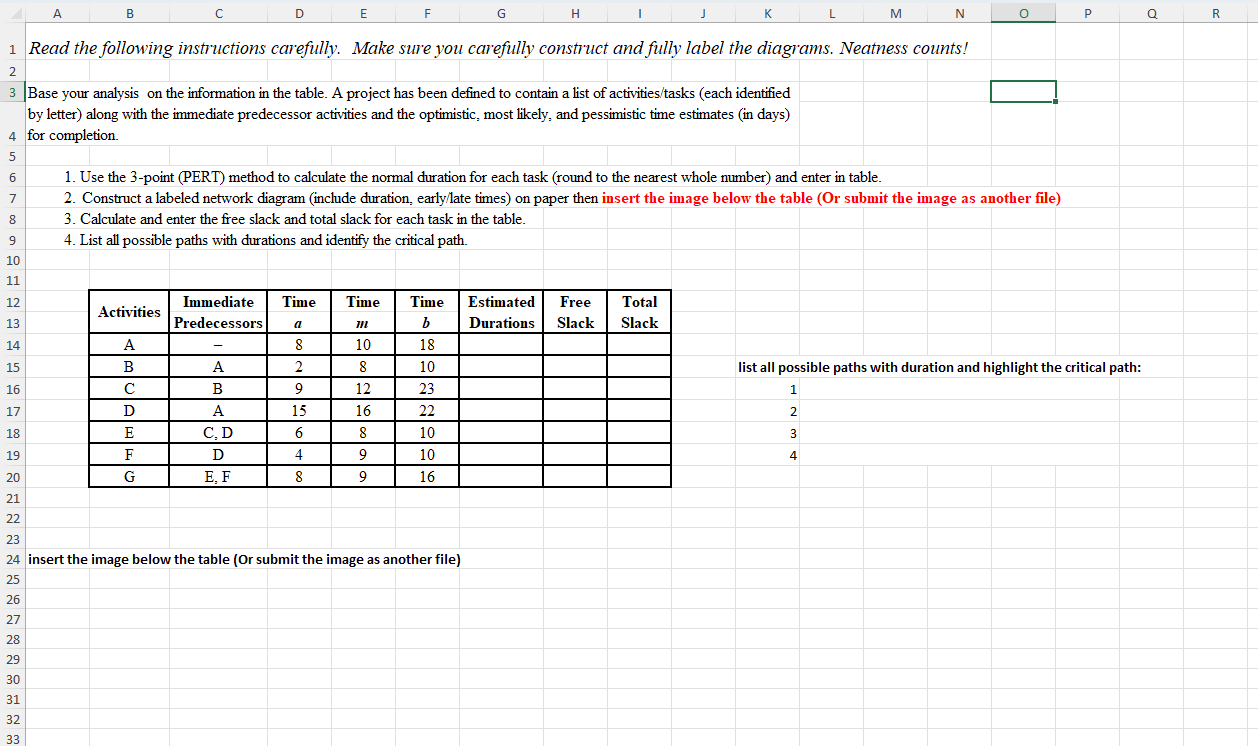
Base your analysis on the information in the table. A project has been defined to contain a list of activitiestasks each identified by letter along with the immediate predecessor activities and the optimistic, most likely, and pessimistic time estimates in days for completion.
Use the point PERT method to calculate the normal duration for each task round to the nearest whole number and enter in table.
Construct a labeled network diagram include duration, earlylate times on paper then insert the image below the table Or submit the image as another file
Calculate and enter the free slack and total slack for each task in the table.
List all possible paths with durations and identify the critical path.
list all possible paths with duration and highlight the critical path:
insert the image below the table Or submit the image as another file
You are the PM for an IT development project. It is the end of the th week of your project, and you want to use the Earned Value Method to
analyze the state of your project. Examine the partial spreadsheet below:
Enter the data in colored cells.
Project Level EVA for a Week Project end of Week
Step by Step Solution
There are 3 Steps involved in it
1 Expert Approved Answer
Step: 1 Unlock

Question Has Been Solved by an Expert!
Get step-by-step solutions from verified subject matter experts
Step: 2 Unlock
Step: 3 Unlock