

Question: Need help calculating the ratios please. 5 6 7 2014 12,257 7,996 Net Revenues Cost of Goods Sold 2015 12,625 8,074 % Change 3.0% 1.0%
Need help calculating the ratios please.
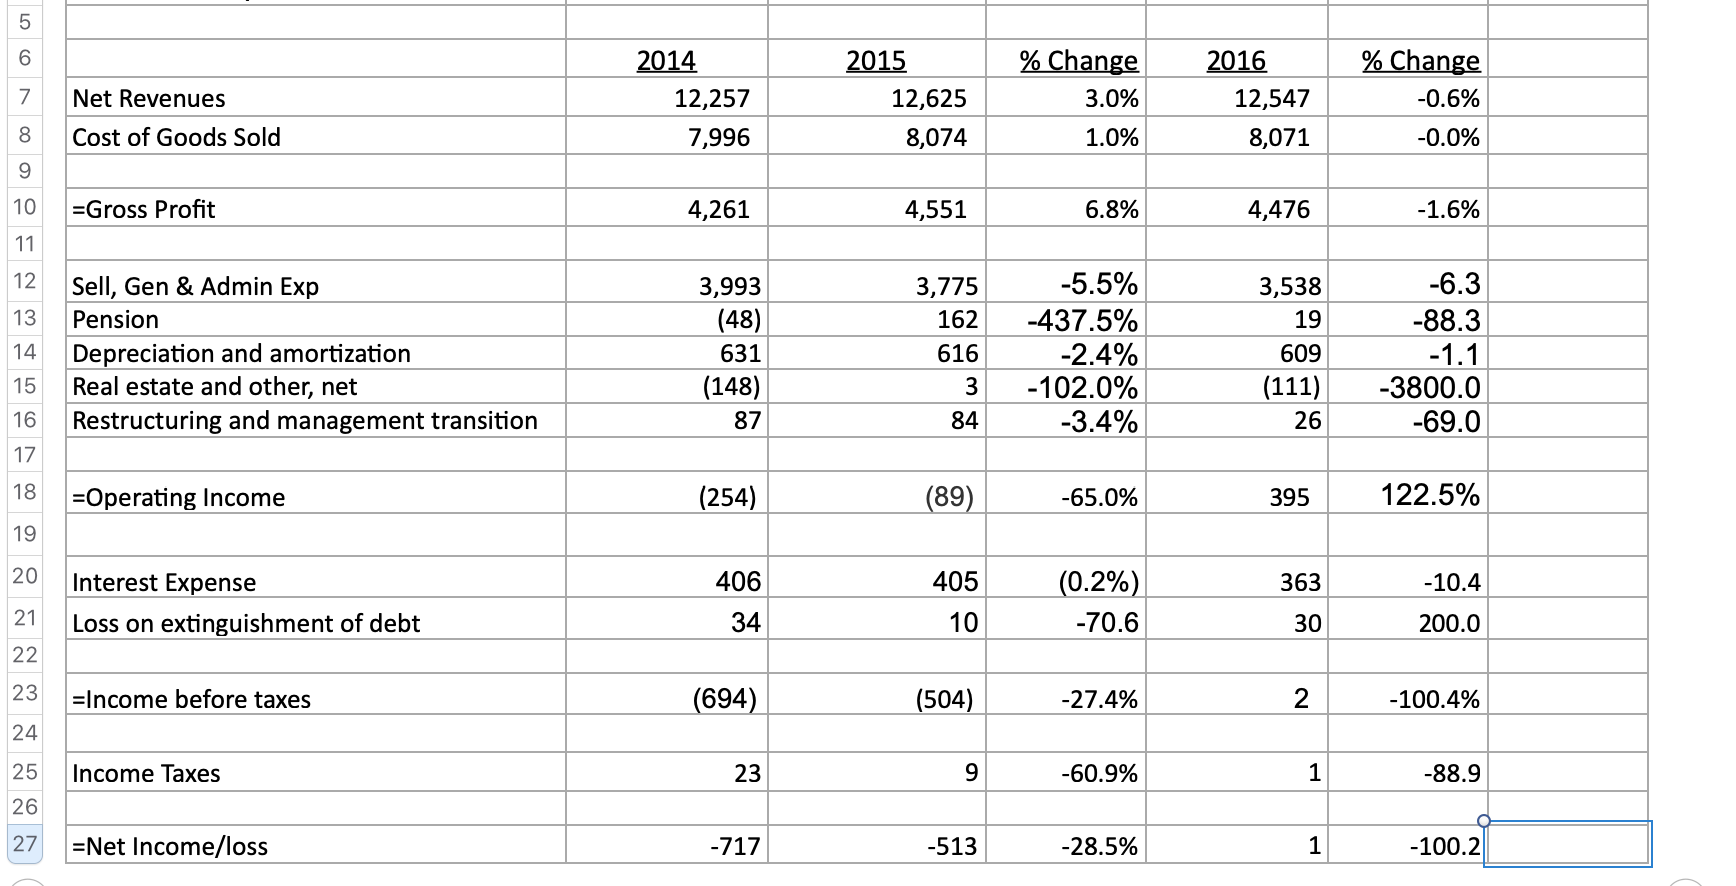
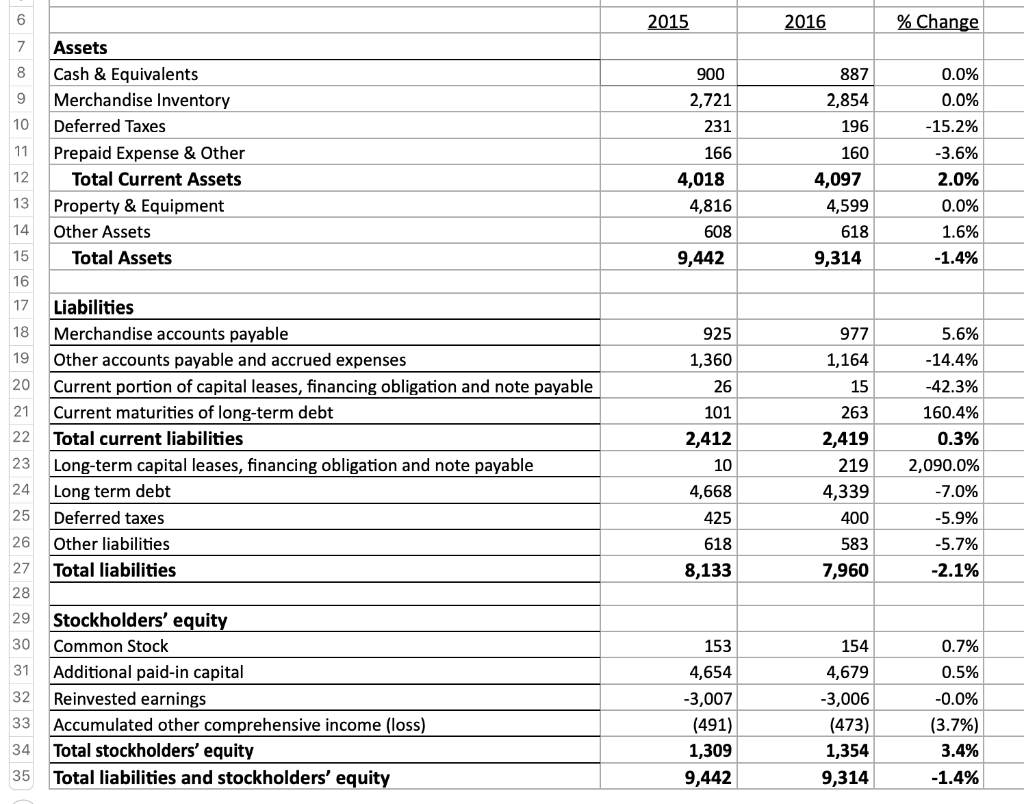
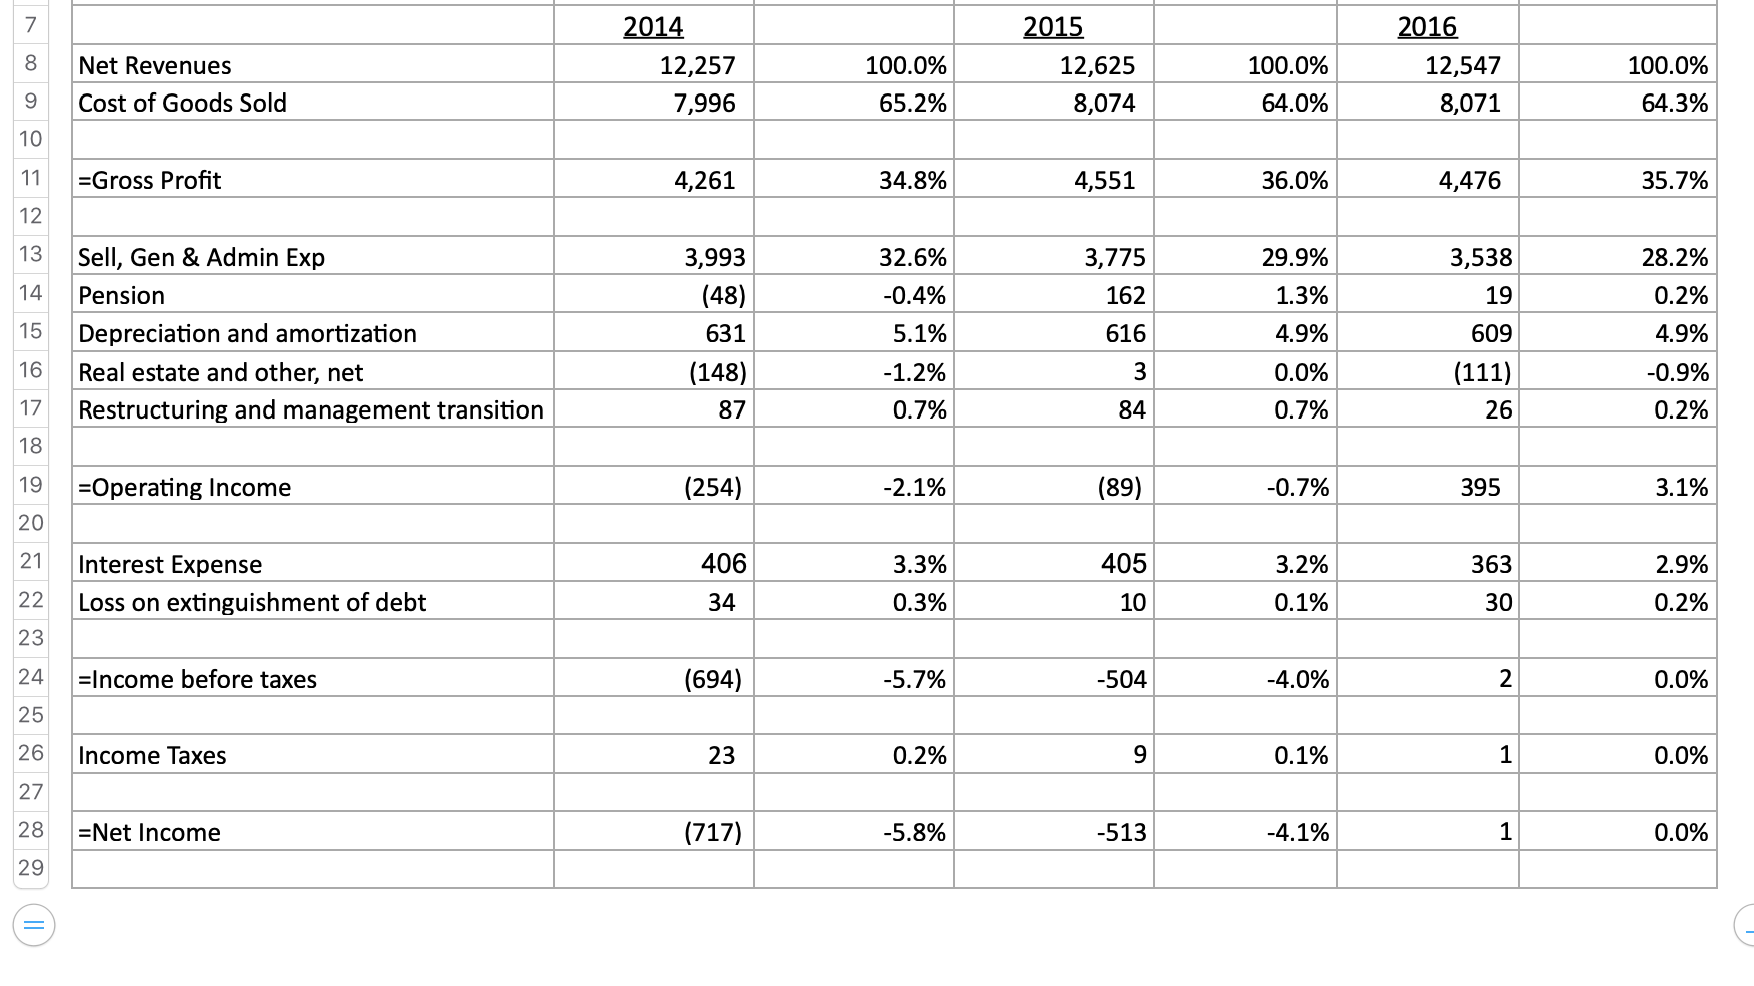
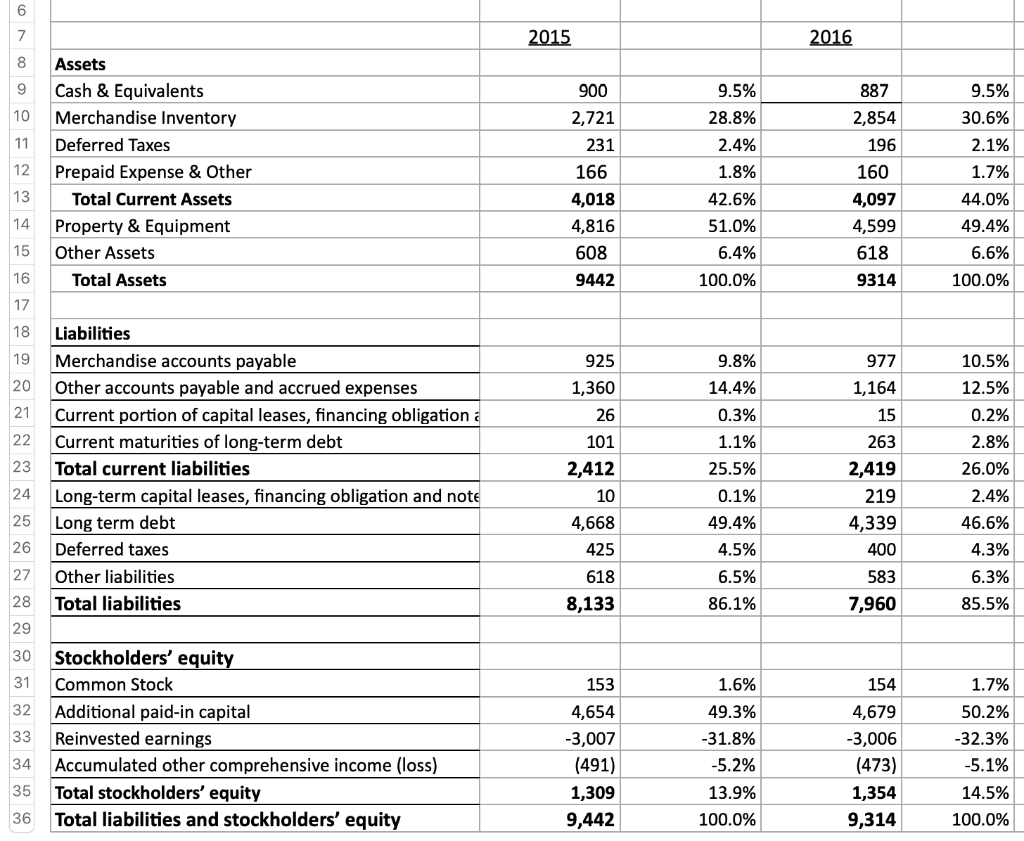
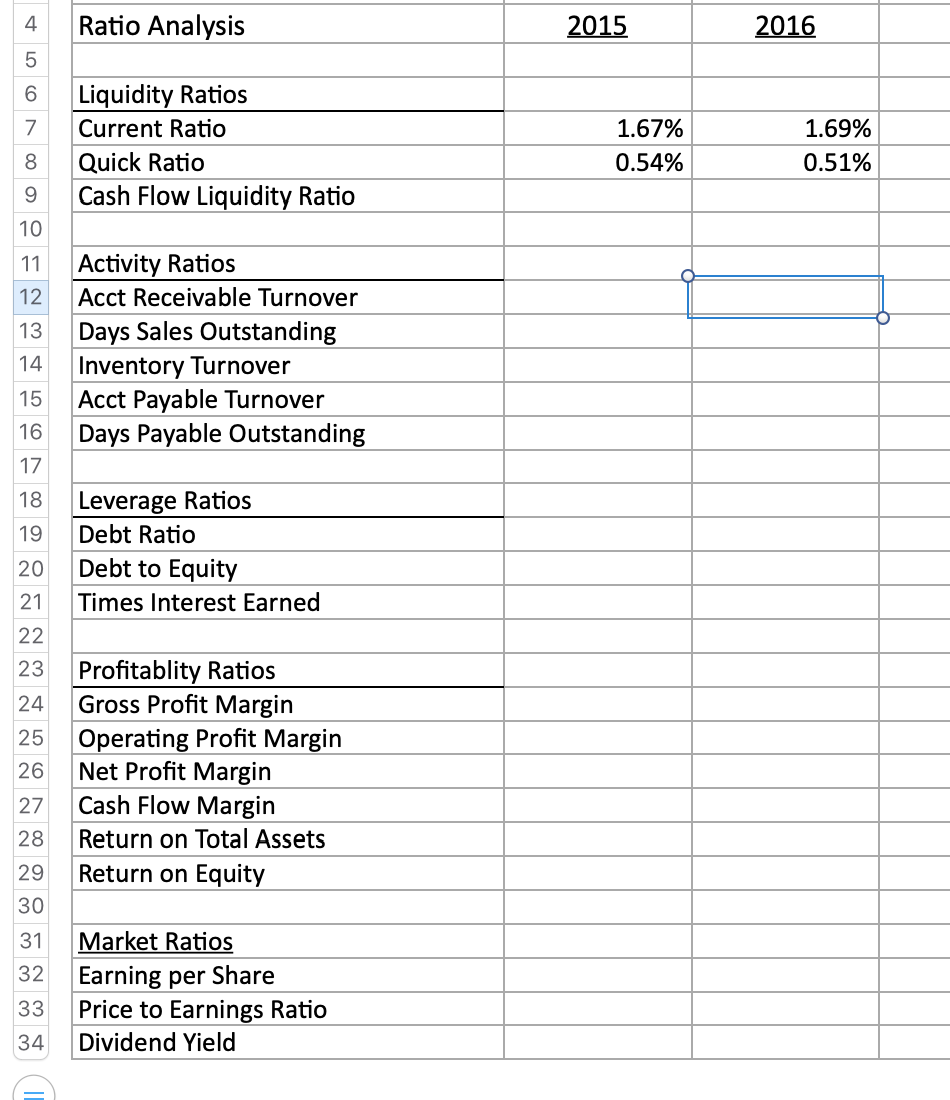
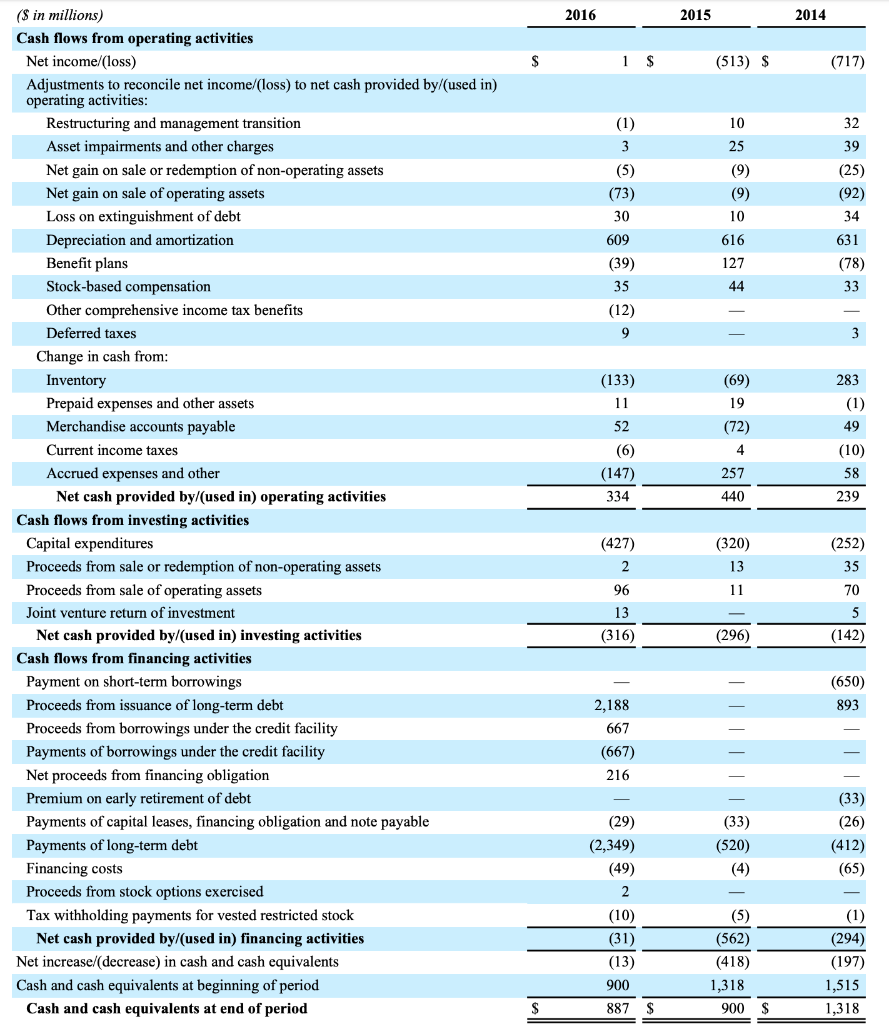
5 6 7 2014 12,257 7,996 Net Revenues Cost of Goods Sold 2015 12,625 8,074 % Change 3.0% 1.0% % Change -0.6% 2016 12,547 8,071 8 -0.0% 9 10 =Gross Profit 4,261 4,551 6.8% 4,476 -1.6% 11 12 13 14 Sell, Gen & Admin Exp Pension Depreciation and amortization Real estate and other, net Restructuring and management transition 3,993 (48) 631 (148) 87 3,775 162 616 3 84 -5.5% -437.5% -2.4% -102.0% -3.4% 3,538 19 609 (111) 26 -6.3 -88.3 -1.1 -3800.0 -69.0 15 16 17 18 =Operating Income (254) (89) -65.0% 395 122.5% 19 20 405 363 -10.4 Interest Expense Loss on extinguishment of debt 406 34 (0.2%) -70.6 21 10 30 200.0 22 23 =Income before taxes (694) (504) -27.4% 2 -100.4% 24 25 Income Taxes 23 9 -60.9% 1 -88.9 26 27 =Net Income/loss -717 -513 -28.5% 1 -100.2 6 2015 2016 % Change 7 8 9 887 2,854 196 0.0% 0.0% -15.2% 10 11 Assets Cash & Equivalents Merchandise Inventory Deferred Taxes Prepaid Expense & Other Total Current Assets Property & Equipment Other Assets Total Assets 900 2,721 231 166 4,018 4,816 608 9,442 12 160 4,097 4,599 13 -3.6% 2.0% 0.0% 1.6% -1.4% 14 618 15 9,314 16 17 18 925 19 1,360 977 1,164 15 20 26 21 22 Liabilities Merchandise accounts payable Other accounts payable and accrued expenses Current portion of capital leases, financing obligation and note payable Current maturities of long-term debt Total current liabilities Long-term capital leases, financing obligation and note payable Long term debt Deferred taxes Other liabilities Total liabilities 23 5.6% -14.4% -42.3% 160.4% 0.3% 2,090.0% -7.0% -5.9% -5.7% -2.1% 101 2,412 10 4,668 425 618 8,133 24 263 2,419 219 4,339 400 583 7,960 25 26 27 28 29 30 0.7% 31 32 Stockholders' equity Common Stock Additional paid-in capital Reinvested earnings Accumulated other comprehensive income (loss) Total stockholders' equity Total liabilities and stockholders' equity 153 4,654 -3,007 (491) 1,309 9,442 154 4,679 -3,006 (473) 1,354 9,314 33 0.5% -0.0% (3.7%) 3.4% -1.4% 34 35 7 8 Net Revenues Cost of Goods Sold 2014 12,257 7,996 100.0% 65.2% 2015 12,625 8,074 100.0% 64.0% 2016 12,547 8,071 100.0% 64.3% 9 10 11 =Gross Profit 4,261 34.8% 4,551 36.0% 4,476 35.7% 12 13 28.2% 3,775 162 14 32.6% -0.4% 5.1% 3,538 19 Sell, Gen & Admin Exp Pension Depreciation and amortization Real estate and other, net Restructuring and management transition 29.9% 1.3% 4.9% 0.2% 3,993 (48) 631 (148) 87 15 616 609 16 -1.2% 3 0.0% 0.7% (111) 26 4.9% -0.9% 0.2% 17 0.7% 84 18 19 =Operating Income (254) -2.1% (89) -0.7% 395 3.1% 20 21 406 405 363 2.9% Interest Expense Loss on extinguishment of debt 3.3% 0.3% 3.2% 0.1% 22 34 10 30 0.2% 23 24 =Income before taxes (694) -5.7% -504 -4.0% 2 0.0% 25 26 Income Taxes 23 0.2% 9 0.1% 1 0.0% 27 28 =Net Income (717) -5.8% -513 -4.1% 1 0.0% 29 6 7 2015 2016 8 9 900 2,721 10 9.5% 28.8% 2.4% 1.8% 11 231 Assets Cash & Equivalents Merchandise Inventory Deferred Taxes Prepaid Expense & Other Total Current Assets Property & Equipment Other Assets Total Assets 12 887 2,854 196 160 4,097 4,599 618 9.5% 30.6% 2.1% 1.7% 44.0% 49.4% 6.6% 100.0% 166 4,018 4,816 608 9442 13 14 42.6% 51.0% 6.4% 100.0% 15 16 9314 17 18 19 925 1,360 26 977 1,164 20 21 15 22 23 Liabilities Merchandise accounts payable Other accounts payable and accrued expenses Current portion of capital leases, financing obligation a Current maturities of long-term debt Total current liabilities Long-term capital leases, financing obligation and note Long term debt Deferred taxes Other liabilities Total liabilities 9.8% 14.4% 0.3% 1.1% 25.5% 0.1% 49.4% 4.5% 6.5% 86.1% 101 2,412 10 4,668 425 618 8,133 24 10.5% 12.5% 0.2% 2.8% 26.0% 2.4% 46.6% 4.3% 6.3% 85.5% 25 263 2,419 219 4,339 400 583 7,960 26 27 28 29 153 32 30 Stockholders' equity 31 Common Stock Additional paid-in capital 33 Reinvested earnings Accumulated other comprehensive income (loss) 35 Total stockholders' equity 36 Total liabilities and stockholders' equity 154 4,679 -3,006 1.6% 49.3% -31.8% -5.2% 13.9% 100.0% 4,654 -3,007 (491) 1,309 9,442 1.7% 50.2% -32.3% -5.1% 14.5% 100.0% 34 (473) 1,354 9,314 4 Ratio Analysis 2015 2016 5 6 7 Liquidity Ratios Current Ratio Quick Ratio Cash Flow Liquidity Ratio 1.67% 0.54% 1.69% 0.51% 8 9 10 11 12 13 14 Activity Ratios Acct Receivable Turnover Days Sales Outstanding Inventory Turnover Acct Payable Turnover Days Payable Outstanding 15 16 17 18 19 Leverage Ratios Debt Ratio Debt to Equity Times Interest Earned 20 21 22 23 24 25 26 Profitablity Ratios Gross Profit Margin Operating Profit Margin Net Profit Margin Cash Flow Margin Return on Total Assets Return on Equity 27 28 29 30 31 32 33 34 Market Ratios Earning per Share Price to Earnings Ratio Dividend Yield 2016 2015 2014 S 1 $ (513) $ (717) 10 32 25 39 TRE (1) 3 (5) (73) 30 (9) (9) 10 616 127 (25) (92) 34 631 (78) 33 609 (39) 35 44 (12) 9 3 283 (133) 11 52 (69) 19 (1) 49 (6) (147) (72) 4 257 (10) 58 334 440 239 ($ in millions) Cash flows from operating activities Net income/loss) Adjustments to reconcile net income/loss) to net cash provided by/(used in) operating activities: Restructuring and management transition Asset impairments and other charges Net gain on sale or redemption of non-operating assets Net gain on sale of operating assets Loss on extinguishment of debt Depreciation and amortization Benefit plans Stock-based compensation Other comprehensive income tax benefits Deferred taxes Change in cash from: Inventory Prepaid expenses and other assets Merchandise accounts payable Current income taxes Accrued expenses and other Net cash provided by/(used in) operating activities Cash flows from investing activities Capital expenditures Proceeds from sale or redemption of non-operating assets Proceeds from sale of operating assets Joint venture return of investment Net cash provided by/(used in) investing activities Cash flows from financing activities Payment on short-term borrowings Proceeds from issuance of long-term debt Proceeds from borrowings under the credit facility Payments of borrowings under the credit facility Net proceeds from financing obligation Premium on early retirement of debt Payments of capital leases, financing obligation and note payable Payments of long-term debt Financing costs Proceeds from stock options exercised Tax withholding payments for vested restricted stock Net cash provided by/(used in) financing activities Net increase/(decrease) in cash and cash equivalents Cash and cash equivalents at beginning of period Cash and cash equivalents at end of period (320) (427) 2 13 11 96 13 (316) (252) 35 70 5 (142) (296) (650) 893 2,188 667 (667) 216 (29) (2,349) (49) 2 (33) (520) (4) (33) (26) (412) (65) (10) (31) (13) 900 887 $ (5) (562) (418) 1,318 900 (1) (294) (197) 1,515 1,318 S $
Step by Step Solution
There are 3 Steps involved in it

Get step-by-step solutions from verified subject matter experts