

Question: need help Coding this on Matlab, need to see the codes and step by step for # 1-7 please. thank you Laplace Transform Worksheet Case
need help Coding this on Matlab, need to see the codes and step by step for # 1-7 please. thank you
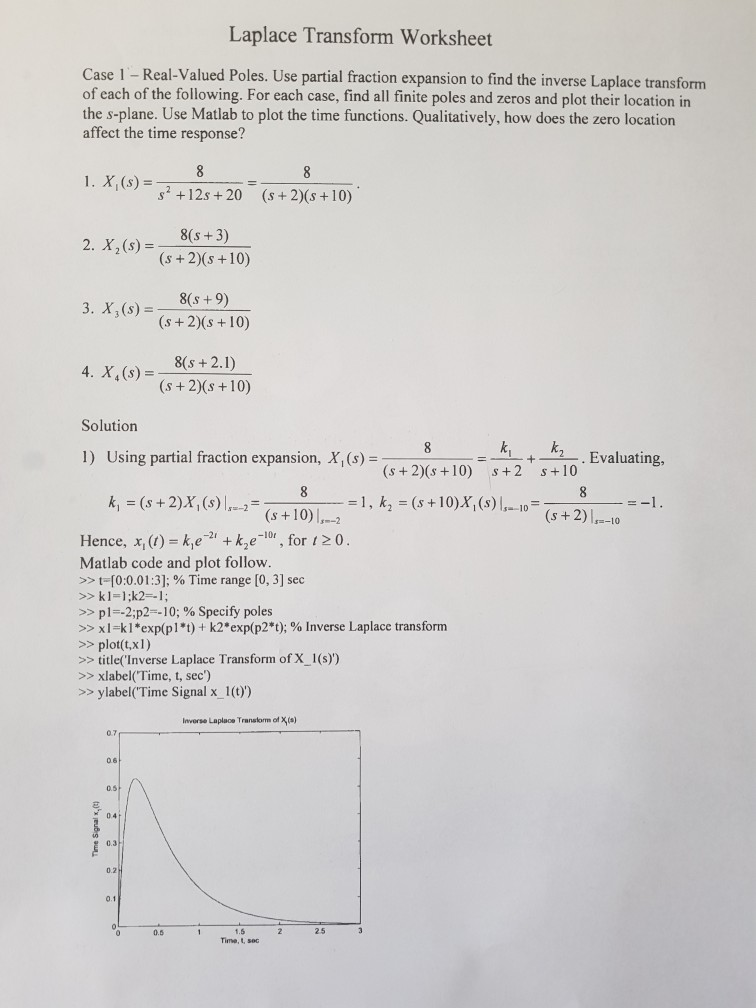
Laplace Transform Worksheet Case 1 - Real-Valued Poles. Use partial fraction expansion to find the inverse Laplace transform of each of the following. For each case, find all finite poles and zeros and plot their location in the s-plane. Use Matlab to plot the time functions. Qualitatively, how does the zero location affect the time response? 1. X,(s) s +12s +20 (s+2)(s+10) 8(s +3) (s +2)(s +10) 2. X,(s) 8(s + 9) (s+ 2)(s +10) 4. X. (s) -(+ 2xs + 10) Solution 1) Using partial fraction expansion, X, (s)- +. Evaluating , (s +2)(s +10) s2 s+10 k, = (s + 2)X, (s)..-2- = 1, k2 = (s +10)X, (s) hel =-1. (s+10) -2 (s +10),--2 (s+ 2) 10 Hence, x, ) ke k,eor, for 20. Matlab code and plot follow. >> t-0:0.01:3]; % Time range [0,3] sec >>pl--2:p2-10;% Specify poles >> x 1-k ! *exp(pl *t) + k2 exp(p2*t); % Inverse Laplace transform >>plot(t,xl) >title(Inverse Laplace Transform of X_1(s)) >>xlabel(Time, t, sec) >>ylabel(Time Signal x 1() Inverse Laplace Transorm of X(s) 0.7 0.4 0.3 0.2 0.1 0.5 2.5 Time, t, sec Laplace Transform Worksheet Case 1 - Real-Valued Poles. Use partial fraction expansion to find the inverse Laplace transform of each of the following. For each case, find all finite poles and zeros and plot their location in the s-plane. Use Matlab to plot the time functions. Qualitatively, how does the zero location affect the time response? 1. X,(s) s +12s +20 (s+2)(s+10) 8(s +3) (s +2)(s +10) 2. X,(s) 8(s + 9) (s+ 2)(s +10) 4. X. (s) -(+ 2xs + 10) Solution 1) Using partial fraction expansion, X, (s)- +. Evaluating , (s +2)(s +10) s2 s+10 k, = (s + 2)X, (s)..-2- = 1, k2 = (s +10)X, (s) hel =-1. (s+10) -2 (s +10),--2 (s+ 2) 10 Hence, x, ) ke k,eor, for 20. Matlab code and plot follow. >> t-0:0.01:3]; % Time range [0,3] sec >>pl--2:p2-10;% Specify poles >> x 1-k ! *exp(pl *t) + k2 exp(p2*t); % Inverse Laplace transform >>plot(t,xl) >title(Inverse Laplace Transform of X_1(s)) >>xlabel(Time, t, sec) >>ylabel(Time Signal x 1() Inverse Laplace Transorm of X(s) 0.7 0.4 0.3 0.2 0.1 0.5 2.5 Time, t, sec
Step by Step Solution
There are 3 Steps involved in it

Get step-by-step solutions from verified subject matter experts