

Question: Need help completing Questions 1-4 PROJECT STEPS 1. Madhu Patel is a sales analyst for Four Winds Energy, a manufacturer of wind energy products, in
Need help completing Questions 1-4
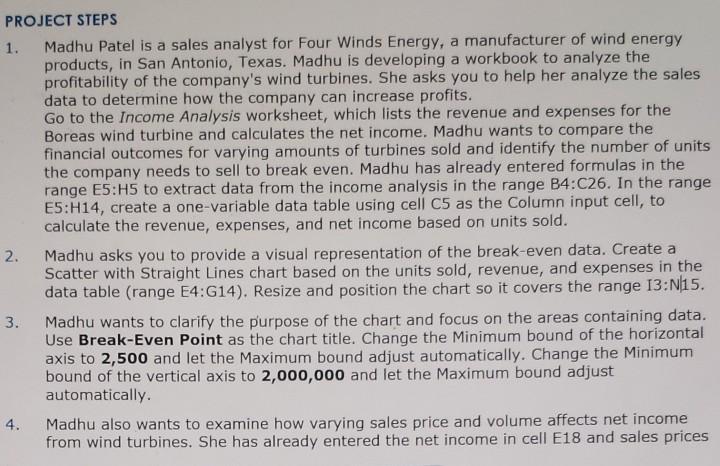
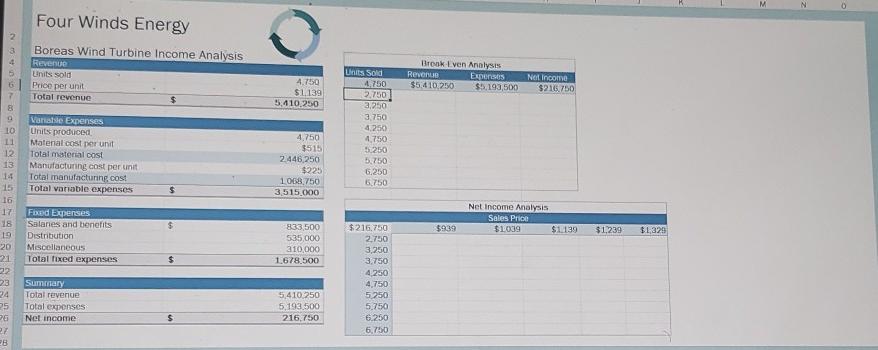
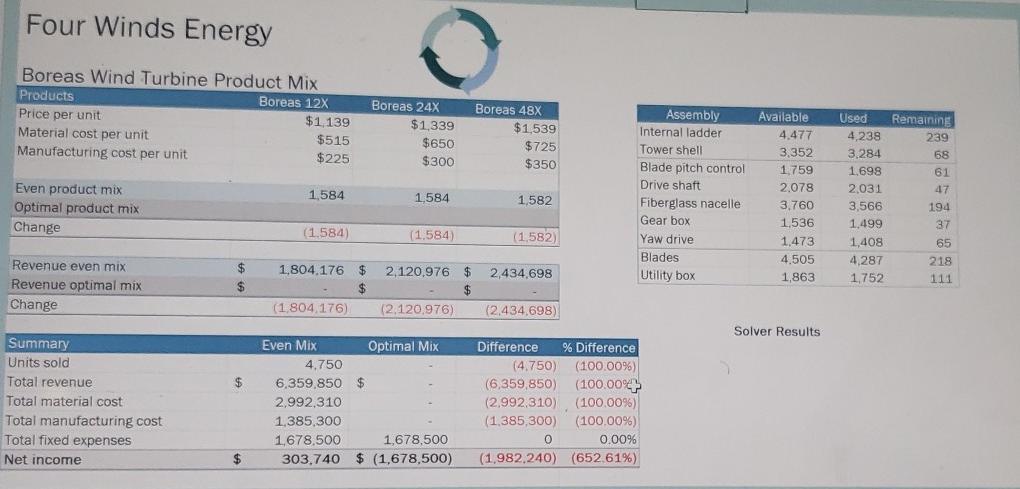
PROJECT STEPS 1. Madhu Patel is a sales analyst for Four Winds Energy, a manufacturer of wind energy products, in San Antonio, Texas. Madhu is developing a workbook to analyze the profitability of the company's wind turbines. She asks you to help her analyze the sales data to determine how the company can increase profits. Go to the Income Analysis worksheet, which lists the revenue and expenses for the Boreas wind turbine and calculates the net income. Madhu wants to compare the financial outcomes for varying amounts of turbines sold and identify the number of units the company needs to sell to break even. Madhu has already entered formulas in the range E5:H5 to extract data from the income analysis in the range B4:C26. In the range E5:H14, create a one-variable data table using cell C5 as the Column input cell, to calculate the revenue, expenses, and net income based on units sold. 2. Madhu asks you to provide a visual representation of the break-even data. Create a Scatter with Straight Lines chart based on the units sold, revenue, and expenses in the data table (range E4:G14). Resize and position the chart so it covers the range 13:N|15. 3. Madhu wants to clarify the purpose of the chart and focus on the areas containing data. Use Break-Even Point as the chart title. Change the Minimum bound of the horizontal axis to 2,500 and let the Maximum bound adjust automatically. Change the Minimum bound of the vertical axis to 2,000,000 and let the Maximum bound adjust automatically. 4. Madhu also wants to examine how varying sales price and volume affects net income from wind turbines. She has already entered the net income in cell E18 and sales prices M N 0 Four Winds Energy Boreas Wind Turbine Income Analysis Revenue Units sold Price per unit Total revenue Brook Even Analysis Reven Experts $5.410.250 $5,193,500 4.70 $1,139 5.410.230 Net Income $216.750 56 ON 10 11 12 13 Vorse Expenses Units produced Materal cost per unit Total material cost Manufacturing cost per unit Total manufacturing cost Total variable expenses Unit Sold 4.750 2.750 3,250 3.750 4.250 4,790 50250 5.750 6.250 5.750 4,750 $515 22446.250 $225 1058,750 3,515.000 Net Income Analysis Sales Price $1039 $1139 $ $939 $1.239 $1,325 Fixed Expenses Salanes and benefits Distribution Miscellaneous Total fixed expenses 15 16 17 18 19 20 21 22 23 24 25 26 27 833 500 535,000 210,000 1.678.500 $ $216.750 2.750 3,250 3.750 4.250 4,750 5.250 5.750 6.250 6.790 Summary Total revenue Total expenses Net income 5,410.250 5,193,500 216.750 $ Four Winds Energy Boreas Wind Turbine Product Mix Products Boreas 12x Price per unit $1 139 Material cost per unit $515 Manufacturing cost per unit $225 Boreas 24x $1,339 $650 $300 Boreas 48X $1.539 $725 $350 1,584 1,584 1,582 Even product mix Optimal product mix Change Assembly Internal ladder Tower shell Blade pitch control Drive shaft Fiberglass nacelle Gear box Yaw drive Blades Utility box Available 4.477 3,352 1,759 2.078 3.760 1,536 1.473 4,505 1,863 Used 4,238 3,284 1,699 2,031 3,566 1,499 1,408 4,287 1,752 Remaining 239 68 61 47 194 37 65 218 111 (1.584) (1.584) (1.582) 1,804.176 $ Revenue even mix Revenue optimal mix Change $ $ 2,434,698 2,120.976 $ $ (2.120.976) (1804.176) (2.434,698) Solver Results $ Summary Units sold Total revenue Total material cost Total manufacturing cost Total fixed expenses Net income Even Mix Optimal Mix 4.750 6,359,850 $ 2,992,310 1,385,300 1,678,500 1,678,500 303.740 $ (1,678,500) Difference % Difference (4.750) (100.00%) (6,359,850) (100.0094 (2,992,310) (100.009) (1.385,300) (100.00%) 0 0.00% (1.982.240) (652.61%) $ PROJECT STEPS 1. Madhu Patel is a sales analyst for Four Winds Energy, a manufacturer of wind energy products, in San Antonio, Texas. Madhu is developing a workbook to analyze the profitability of the company's wind turbines. She asks you to help her analyze the sales data to determine how the company can increase profits. Go to the Income Analysis worksheet, which lists the revenue and expenses for the Boreas wind turbine and calculates the net income. Madhu wants to compare the financial outcomes for varying amounts of turbines sold and identify the number of units the company needs to sell to break even. Madhu has already entered formulas in the range E5:H5 to extract data from the income analysis in the range B4:C26. In the range E5:H14, create a one-variable data table using cell C5 as the Column input cell, to calculate the revenue, expenses, and net income based on units sold. 2. Madhu asks you to provide a visual representation of the break-even data. Create a Scatter with Straight Lines chart based on the units sold, revenue, and expenses in the data table (range E4:G14). Resize and position the chart so it covers the range 13:N|15. 3. Madhu wants to clarify the purpose of the chart and focus on the areas containing data. Use Break-Even Point as the chart title. Change the Minimum bound of the horizontal axis to 2,500 and let the Maximum bound adjust automatically. Change the Minimum bound of the vertical axis to 2,000,000 and let the Maximum bound adjust automatically. 4. Madhu also wants to examine how varying sales price and volume affects net income from wind turbines. She has already entered the net income in cell E18 and sales prices M N 0 Four Winds Energy Boreas Wind Turbine Income Analysis Revenue Units sold Price per unit Total revenue Brook Even Analysis Reven Experts $5.410.250 $5,193,500 4.70 $1,139 5.410.230 Net Income $216.750 56 ON 10 11 12 13 Vorse Expenses Units produced Materal cost per unit Total material cost Manufacturing cost per unit Total manufacturing cost Total variable expenses Unit Sold 4.750 2.750 3,250 3.750 4.250 4,790 50250 5.750 6.250 5.750 4,750 $515 22446.250 $225 1058,750 3,515.000 Net Income Analysis Sales Price $1039 $1139 $ $939 $1.239 $1,325 Fixed Expenses Salanes and benefits Distribution Miscellaneous Total fixed expenses 15 16 17 18 19 20 21 22 23 24 25 26 27 833 500 535,000 210,000 1.678.500 $ $216.750 2.750 3,250 3.750 4.250 4,750 5.250 5.750 6.250 6.790 Summary Total revenue Total expenses Net income 5,410.250 5,193,500 216.750 $ Four Winds Energy Boreas Wind Turbine Product Mix Products Boreas 12x Price per unit $1 139 Material cost per unit $515 Manufacturing cost per unit $225 Boreas 24x $1,339 $650 $300 Boreas 48X $1.539 $725 $350 1,584 1,584 1,582 Even product mix Optimal product mix Change Assembly Internal ladder Tower shell Blade pitch control Drive shaft Fiberglass nacelle Gear box Yaw drive Blades Utility box Available 4.477 3,352 1,759 2.078 3.760 1,536 1.473 4,505 1,863 Used 4,238 3,284 1,699 2,031 3,566 1,499 1,408 4,287 1,752 Remaining 239 68 61 47 194 37 65 218 111 (1.584) (1.584) (1.582) 1,804.176 $ Revenue even mix Revenue optimal mix Change $ $ 2,434,698 2,120.976 $ $ (2.120.976) (1804.176) (2.434,698) Solver Results $ Summary Units sold Total revenue Total material cost Total manufacturing cost Total fixed expenses Net income Even Mix Optimal Mix 4.750 6,359,850 $ 2,992,310 1,385,300 1,678,500 1,678,500 303.740 $ (1,678,500) Difference % Difference (4.750) (100.00%) (6,359,850) (100.0094 (2,992,310) (100.009) (1.385,300) (100.00%) 0 0.00% (1.982.240) (652.61%) $
Step by Step Solution
There are 3 Steps involved in it

Get step-by-step solutions from verified subject matter experts