

Question: Need help completing this chart on this excel file The purpose of this exercise is to discuss the situation facing a manager and help her
Need help completing this chart on this excel file 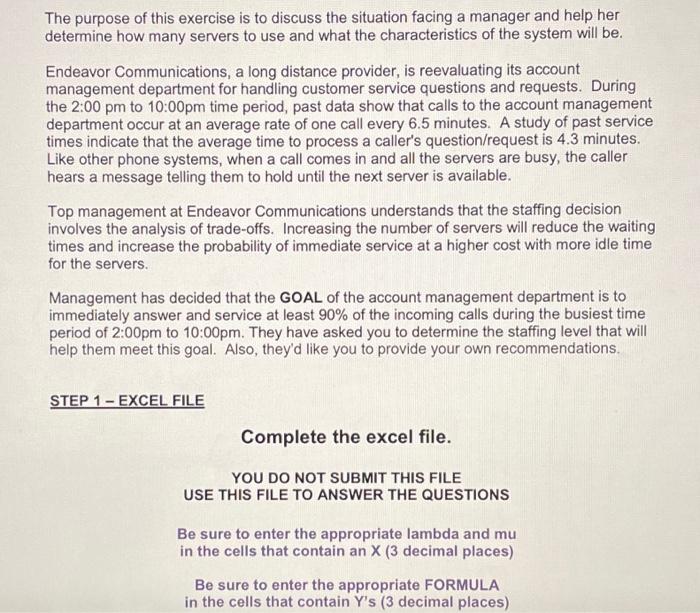
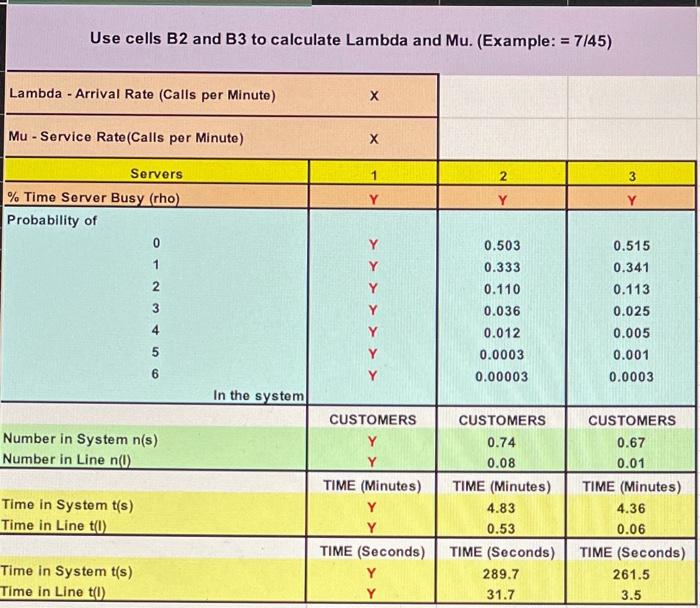
The purpose of this exercise is to discuss the situation facing a manager and help her determine how many servers to use and what the characteristics of the system will be. Endeavor Communications, a long distance provider, is reevaluating its account management department for handling customer service questions and requests. During the 2:00 pm to 10:00pm time period, past data show that calls to the account management department occur at an average rate of one call every 6.5 minutes. A study of past service times indicate that the average time to process a caller's question/request is 4.3 minutes. Like other phone systems, when a call comes in and all the servers are busy, the caller hears a message telling them to hold until the next server is available. Top management at Endeavor Communications understands that the staffing decision involves the analysis of trade-offs. Increasing the number of servers will reduce the waiting times and increase the probability of immediate service at a higher cost with more idle time for the servers. Management has decided that the GOAL of the account management department is to immediately answer and service at least 90% of the incoming calls during the busiest time period of 2:00pm to 10:00pm. They have asked you to determine the staffing level that will help them meet this goal. Also, they'd like you to provide your own recommendations. STEP 1 - EXCEL FILE Complete the excel file. YOU DO NOT SUBMIT THIS FILE USE THIS FILE TO ANSWER THE QUESTIONS Be sure to enter the appropriate lambda and mu in the cells that contain an X (3 decimal places) Be sure to enter the appropriate FORMULA in the cells that contain Y's (3 decimal places) Use cells B2 and B3 to calculate Lambda and Mu. (Example: = 7/45) Lambda - Arrival Rate (Calls per Minute) Mu - Service Rate(Calls per Minute) - 3 Servers % Time Server Busy (rho) Probability of Y Y 1 3 0.503 0.333 0.110 0.036 0.012 0.0003 0.00003 0.515 0.341 0.113 0.025 0.005 0.001 0.0003 4 Y 5 6 Y In the system Number in System n(s) Number in Line n() CUSTOMERS Y Y TIME (Minutes) Y : Time in System t(s) Time in Line tu) CUSTOMERS 0.74 0.08 TIME (Minutes) 4.83 0.53 TIME (Seconds) 289.7 31.7 CUSTOMERS 0.67 0.01 TIME (Minutes) 4.36 0.06 TIME (Seconds) 261.5 3.5 Time in System t(s) Time in Line tu) TIME (Seconds) Y Y Step by Step Solution
There are 3 Steps involved in it
1 Expert Approved Answer
Step: 1 Unlock

Question Has Been Solved by an Expert!
Get step-by-step solutions from verified subject matter experts
Step: 2 Unlock
Step: 3 Unlock