

Question: Need help completing this Physics Energy report. Measurement provided and some calculations. Also need help answering questions 1-5. V. EXPERIMENT 1.05: ENERGY A body slides
Need help completing this Physics Energy report.
Measurement provided and some calculations.
Also need help answering questions 1-5.
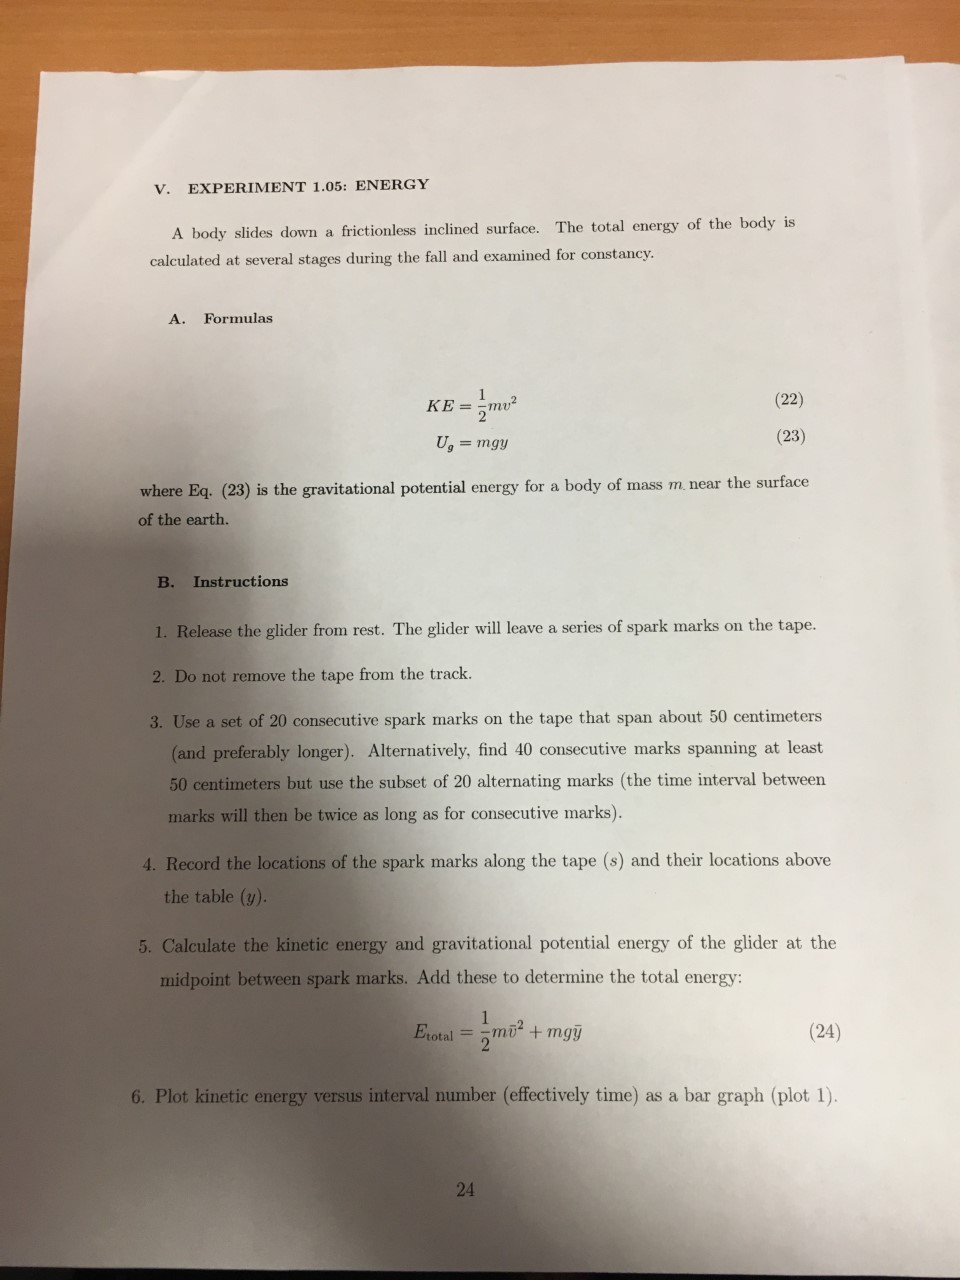
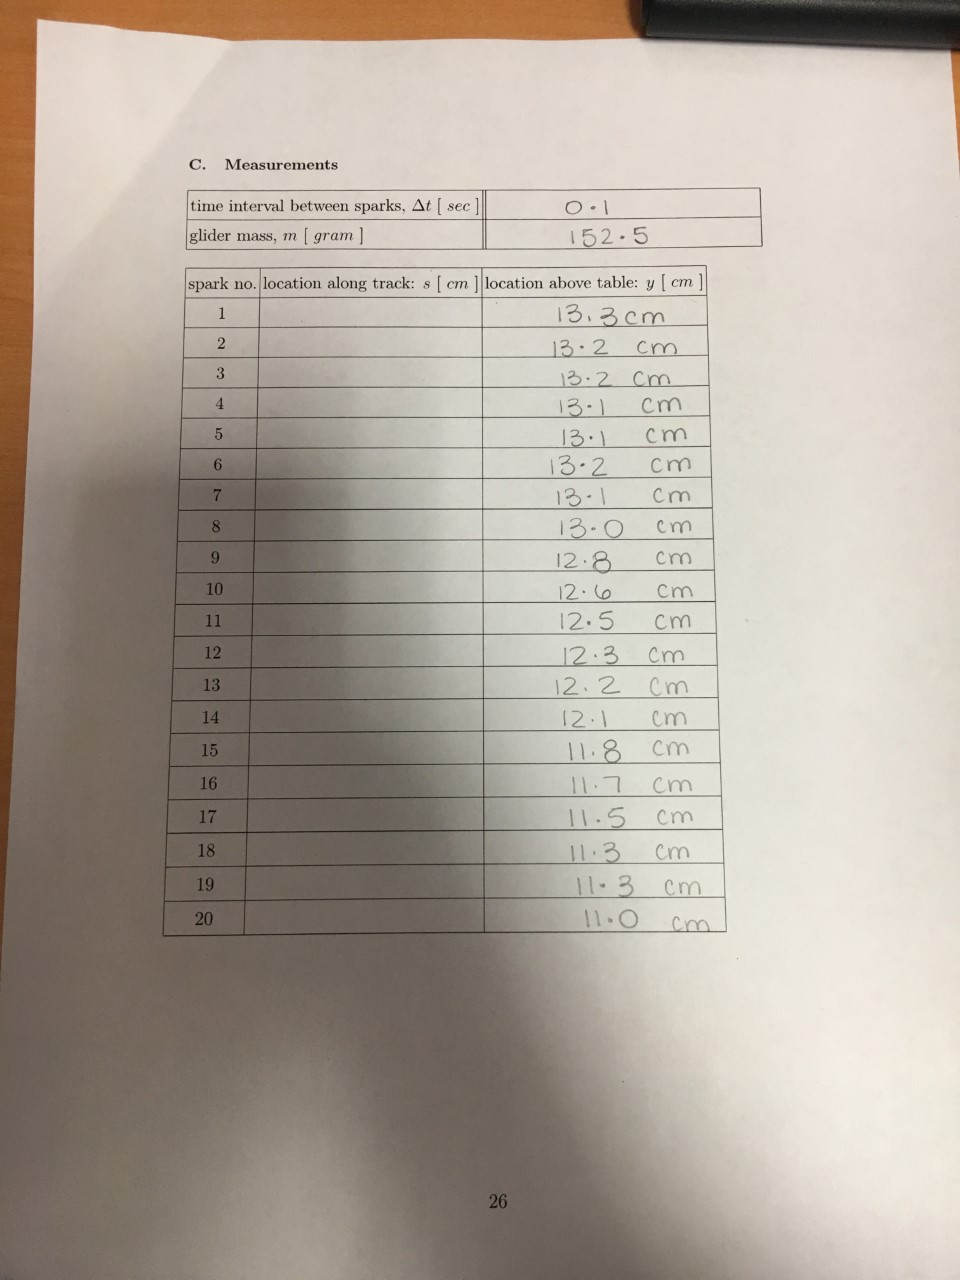
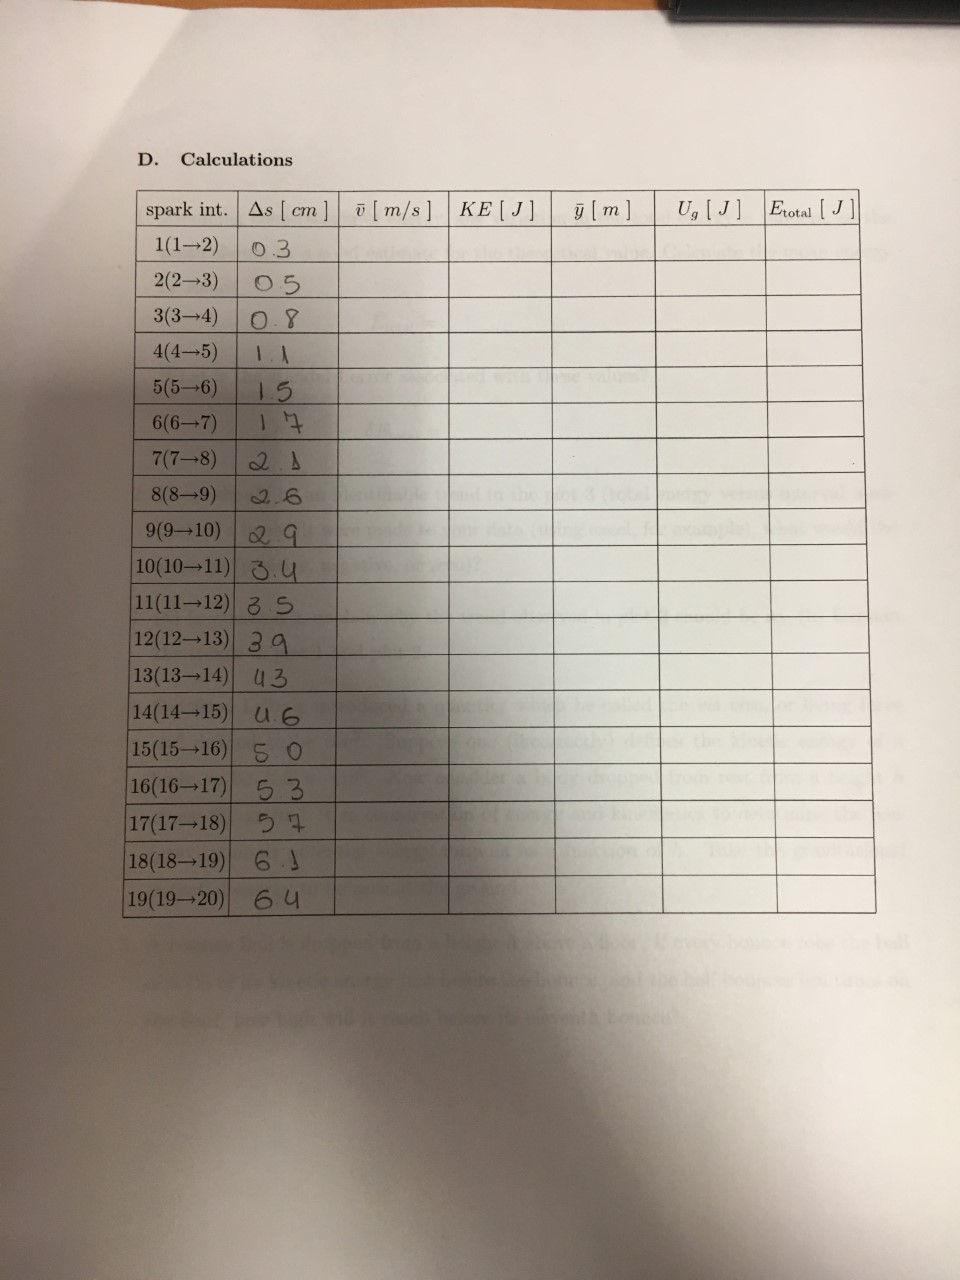
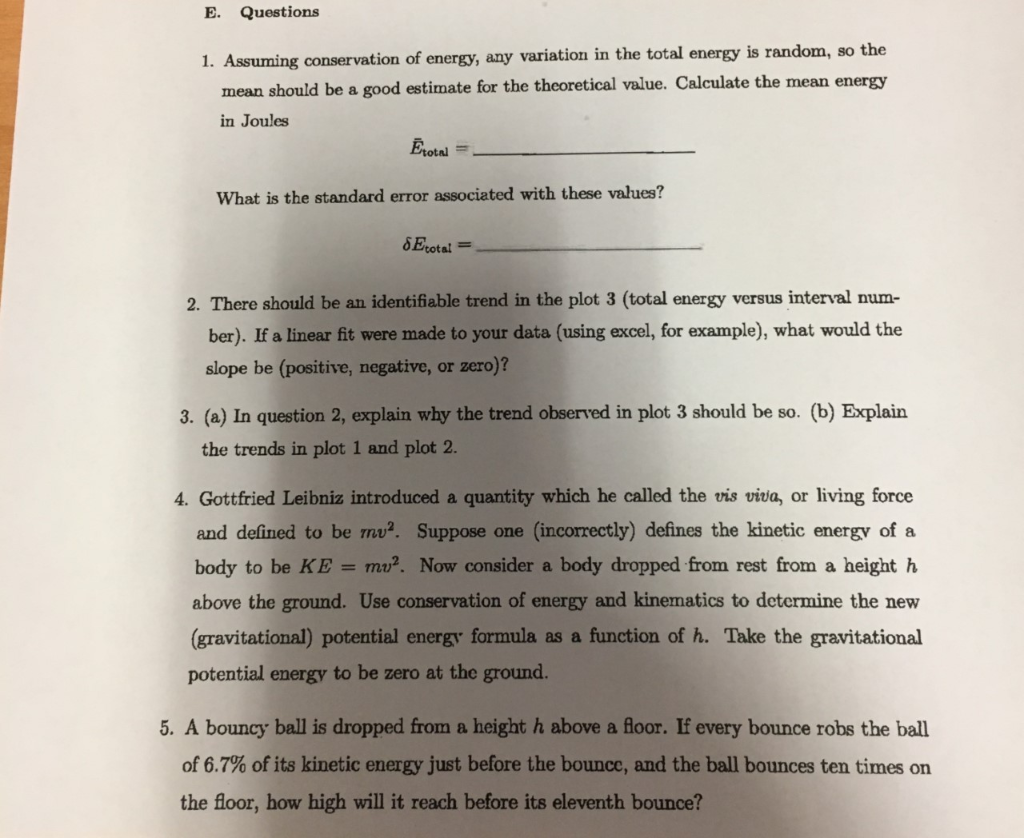
V. EXPERIMENT 1.05: ENERGY A body slides down a frictionless inclined surface. The total energy of the body is calculated at several stages during the fall and examined for constancy. A. Formulas (22) KE = mv? U, = mgy (23) where Eq. (23) is the gravitational potential energy for a body of mass m near the surface of the earth. B. Instructions 1. Release the glider from rest. The glider will leave a series of spark marks on the tape. 2. Do not remove the tape from the track. 3. Use a set of 20 consecutive spark marks on the tape that span about 50 centimeters (and preferably longer). Alternatively, find 40 consecutive marks spanning at least 50 centimeters but use the subset of 20 alternating marks the time interval between marks will then be twice as long as for consecutive marks). 4. Record the locations of the spark marks along the tape (s) and their locations above the table (y) 5. Calculate the kinetic energy and gravitational potential energy of the glider at the midpoint between spark marks. Add these to determine the total energy: Erotal = 3mo? + mg7 (24) 6. Plot kinetic energy versus interval number (effectively time) as a bar graph (plot 1). 24 7. Plot gravitational potential energy versus interval number (effectively time) as a bar graph (plot 2). 8. Plot total energy versus interval number effectively time) as a bar graph (plot 3). Make sure the range of the (vertical) energy axis includes the zero of energy. C. Measurements time interval between sparks, At ( sec] glider mass, m ( gram] 0 .1 152.5 spark no. location along track: 8( cm location above table: y [cm] 13.3cm 13.2 cm 13.2 cm 13.1 cm 13.1 cm 13.2 cm 13.1 cm 13. 0 cm 12.8 cm 10 12.6 cm 11 12.5 cm 12 12.3 cm 13 12.2 cm 14 12.1 cm 11.8 cm 16 11.7 cm 17 11.5 cm 18 11.3 cm 19 11.3 cm 20 15 11.0 cm D. Calculations q[m] 0,[1] Erotal [J] spark int. As [cm] o [m/s] KE[J] 1(1-2) 0.3 2(23) 05 3(3-4) 0.8 4(4-5) 5(5-76) 1.5 6(6-7) 17 7(78) as 8(8-9) 2.6 9(910) 29 10(1011) 3.4 11(1112) 35 12(1213) 39 13(1314) 43 14(1415) 1.6 15(1516) 5 0 16(16-17) 5 3 17(1718) 57 18(1819) 6.1 19(1920) 6.4 E. Questions 1. Assuming conservation of energy, any variation in the total energy is random, so the mean should be a good estimate for the theoretical value. Calculate the mean energy in Joules total = What is the standard error associated with these values? Etotal = 2. There should be an identifiable trend in the plot 3 (total energy versus interval num- ber). If a linear fit were made to your data (using excel, for example), what would the slope be (positive, negative, or zero)? 3. (a) In question 2, explain why the trend observed in plot 3 should be so. (b) Explain the trends in plot 1 and plot 2. 4. Gottfried Leibniz introduced a quantity which he called the vis viva, or living force and defined to be mv. Suppose one (incorrectly) defines the kinetic energy of a body to be KE = mu?. Now consider a body dropped from rest from a height h above the ground. Use conservation of energy and kinematics to determine the new (gravitational) potential energy formula as a function of h. Take the gravitational potential energy to be zero at the ground. 5. A bouncy ball is dropped from a height h above a floor. If every bounce robs the ball of 6.7% of its kinetic energy just before the bounce, and the ball bounces ten times on the floor, how high will it reach before its eleventh bounce? V. EXPERIMENT 1.05: ENERGY A body slides down a frictionless inclined surface. The total energy of the body is calculated at several stages during the fall and examined for constancy. A. Formulas (22) KE = mv? U, = mgy (23) where Eq. (23) is the gravitational potential energy for a body of mass m near the surface of the earth. B. Instructions 1. Release the glider from rest. The glider will leave a series of spark marks on the tape. 2. Do not remove the tape from the track. 3. Use a set of 20 consecutive spark marks on the tape that span about 50 centimeters (and preferably longer). Alternatively, find 40 consecutive marks spanning at least 50 centimeters but use the subset of 20 alternating marks the time interval between marks will then be twice as long as for consecutive marks). 4. Record the locations of the spark marks along the tape (s) and their locations above the table (y) 5. Calculate the kinetic energy and gravitational potential energy of the glider at the midpoint between spark marks. Add these to determine the total energy: Erotal = 3mo? + mg7 (24) 6. Plot kinetic energy versus interval number (effectively time) as a bar graph (plot 1). 24 7. Plot gravitational potential energy versus interval number (effectively time) as a bar graph (plot 2). 8. Plot total energy versus interval number effectively time) as a bar graph (plot 3). Make sure the range of the (vertical) energy axis includes the zero of energy. C. Measurements time interval between sparks, At ( sec] glider mass, m ( gram] 0 .1 152.5 spark no. location along track: 8( cm location above table: y [cm] 13.3cm 13.2 cm 13.2 cm 13.1 cm 13.1 cm 13.2 cm 13.1 cm 13. 0 cm 12.8 cm 10 12.6 cm 11 12.5 cm 12 12.3 cm 13 12.2 cm 14 12.1 cm 11.8 cm 16 11.7 cm 17 11.5 cm 18 11.3 cm 19 11.3 cm 20 15 11.0 cm D. Calculations q[m] 0,[1] Erotal [J] spark int. As [cm] o [m/s] KE[J] 1(1-2) 0.3 2(23) 05 3(3-4) 0.8 4(4-5) 5(5-76) 1.5 6(6-7) 17 7(78) as 8(8-9) 2.6 9(910) 29 10(1011) 3.4 11(1112) 35 12(1213) 39 13(1314) 43 14(1415) 1.6 15(1516) 5 0 16(16-17) 5 3 17(1718) 57 18(1819) 6.1 19(1920) 6.4 E. Questions 1. Assuming conservation of energy, any variation in the total energy is random, so the mean should be a good estimate for the theoretical value. Calculate the mean energy in Joules total = What is the standard error associated with these values? Etotal = 2. There should be an identifiable trend in the plot 3 (total energy versus interval num- ber). If a linear fit were made to your data (using excel, for example), what would the slope be (positive, negative, or zero)? 3. (a) In question 2, explain why the trend observed in plot 3 should be so. (b) Explain the trends in plot 1 and plot 2. 4. Gottfried Leibniz introduced a quantity which he called the vis viva, or living force and defined to be mv. Suppose one (incorrectly) defines the kinetic energy of a body to be KE = mu?. Now consider a body dropped from rest from a height h above the ground. Use conservation of energy and kinematics to determine the new (gravitational) potential energy formula as a function of h. Take the gravitational potential energy to be zero at the ground. 5. A bouncy ball is dropped from a height h above a floor. If every bounce robs the ball of 6.7% of its kinetic energy just before the bounce, and the ball bounces ten times on the floor, how high will it reach before its eleventh bounce
Step by Step Solution
There are 3 Steps involved in it

Get step-by-step solutions from verified subject matter experts