

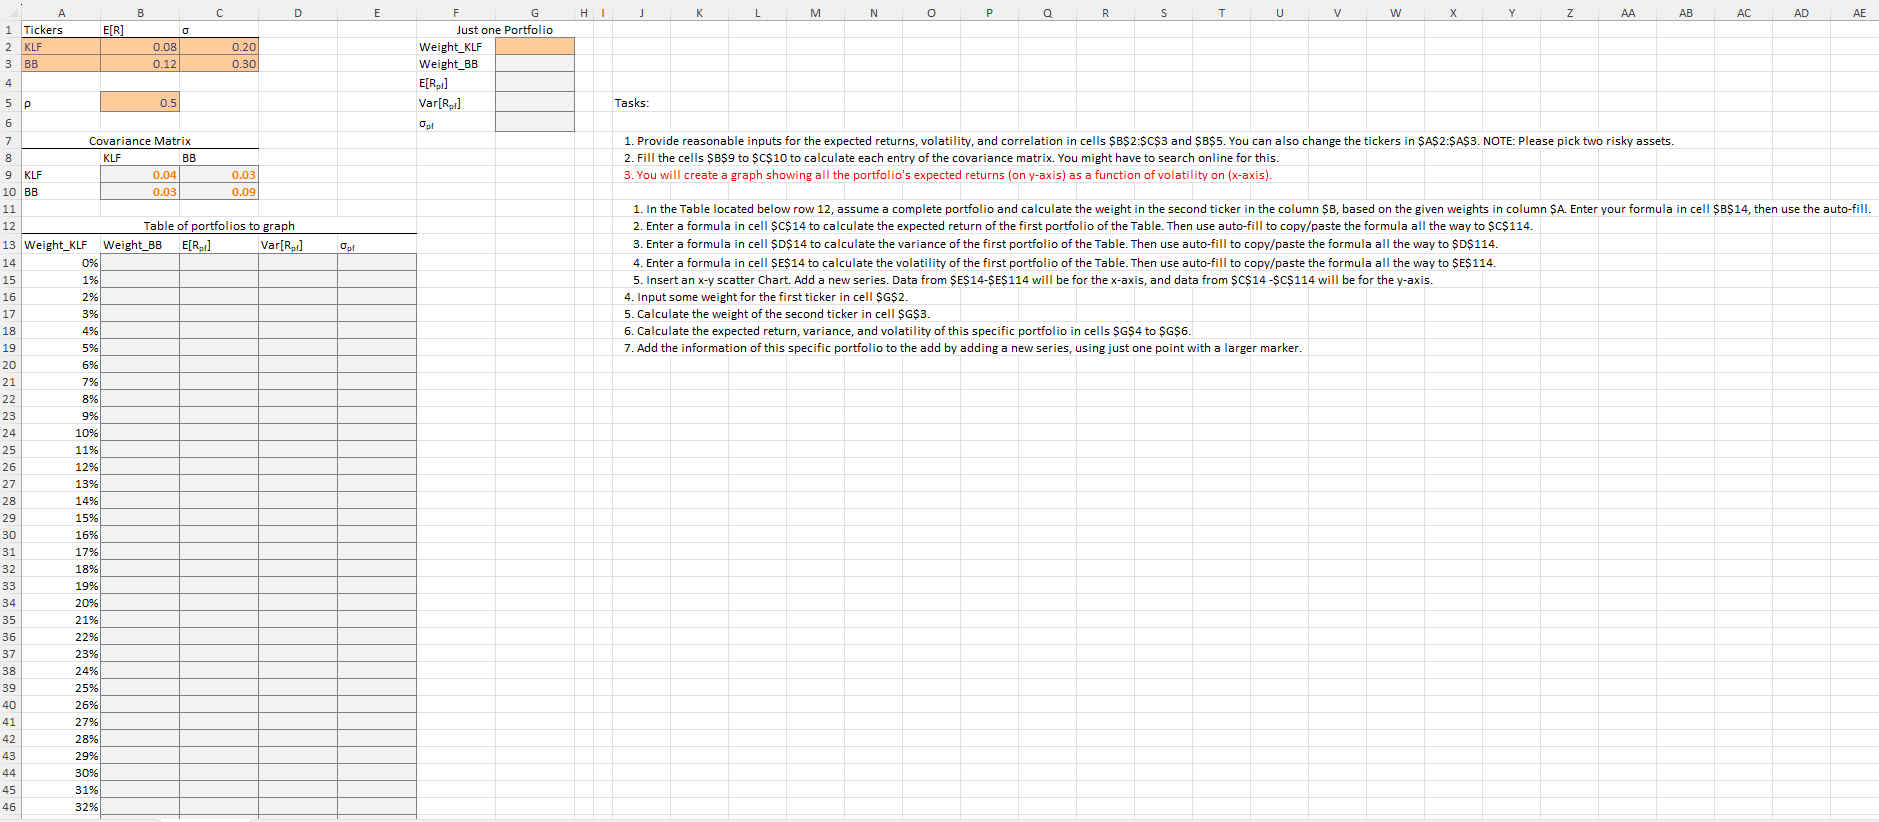
Question: Need help creating a graph showing all the portfolio's expected returns (on y-axis) as a function of volatility on (x-axis). See instruction step 3 in
Need help creating a graph showing all the portfolio's expected returns (on y-axis) as a function of volatility on (x-axis). See instruction step 3 in Red.
Step by Step Solution
There are 3 Steps involved in it
1 Expert Approved Answer
Step: 1 Unlock

Question Has Been Solved by an Expert!
Get step-by-step solutions from verified subject matter experts
Step: 2 Unlock
Step: 3 Unlock