

Question: Need help creating this graph in R. Please show all code so I can look up the definition and terminologies to the conditions you are
Need help creating this graph in R. Please show all code so I can look up the definition and terminologies to the conditions you are using.
mtcars dataframe.
# Recreate the bar graph on blackboard created from the mtcars data frame. You # will need to calculate the mean MPG values for cars with different numbers of # cylinders and gears. You will also create error bars that represent +/- 1 # standard from the mean.
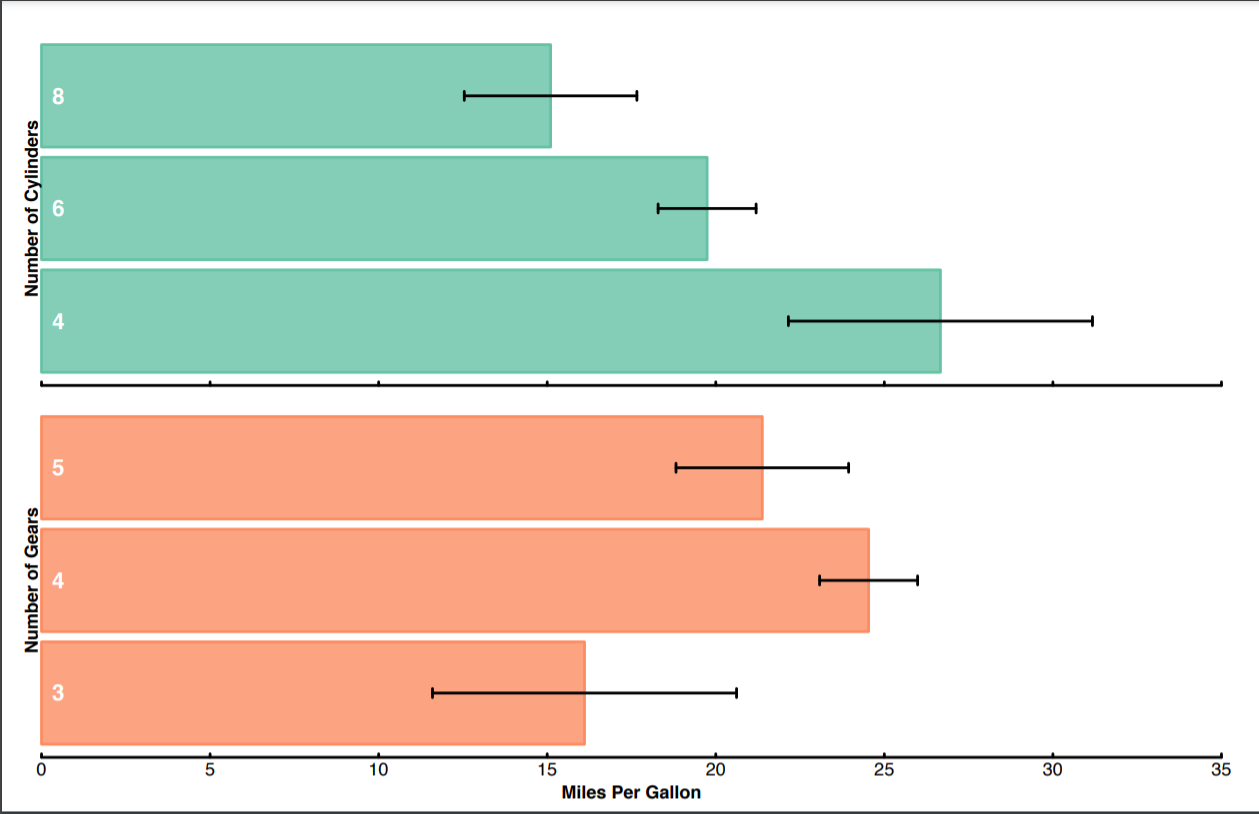
Number of Gears Number of Cylinders Miles Per Gallon G Number of Gears Number of Cylinders Miles Per Gallon G
Step by Step Solution
There are 3 Steps involved in it
1 Expert Approved Answer
Step: 1 Unlock

Question Has Been Solved by an Expert!
Get step-by-step solutions from verified subject matter experts
Step: 2 Unlock
Step: 3 Unlock