

Question: Need help creating this graph using Python thanks. All the inforamtion is in the graph Profit and Sales by Quarter 2017 20.0 17.5 15.0 S
Need help creating this graph using Python thanks. All the inforamtion is in the graph
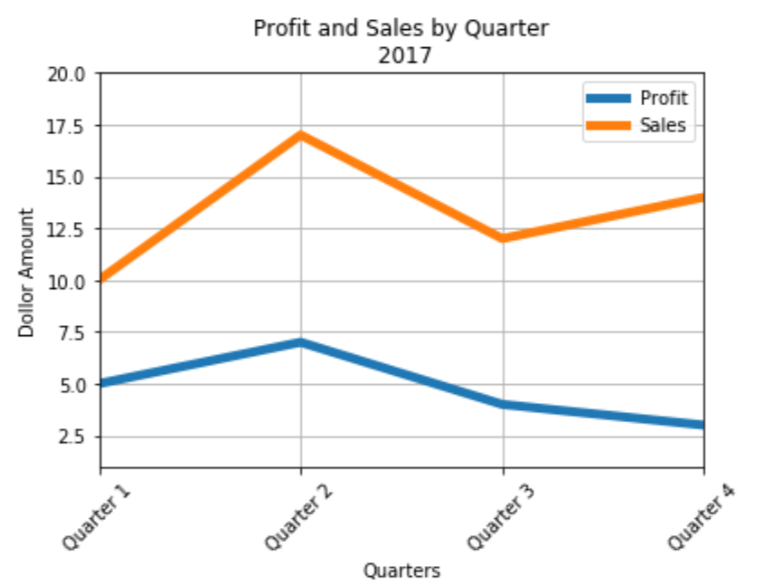
Profit and Sales by Quarter 2017 20.0 17.5 15.0 S 12.5 10.0 Profit Sales 5.0 2.5 Quarters
Step by Step Solution
There are 3 Steps involved in it
1 Expert Approved Answer
Step: 1 Unlock

Question Has Been Solved by an Expert!
Get step-by-step solutions from verified subject matter experts
Step: 2 Unlock
Step: 3 Unlock