

Question: Need help figuring out the scatter plot. fThe table shows the mathematics entrance test scores x and the final exam test scores y In an
Need help figuring out the scatter plot.

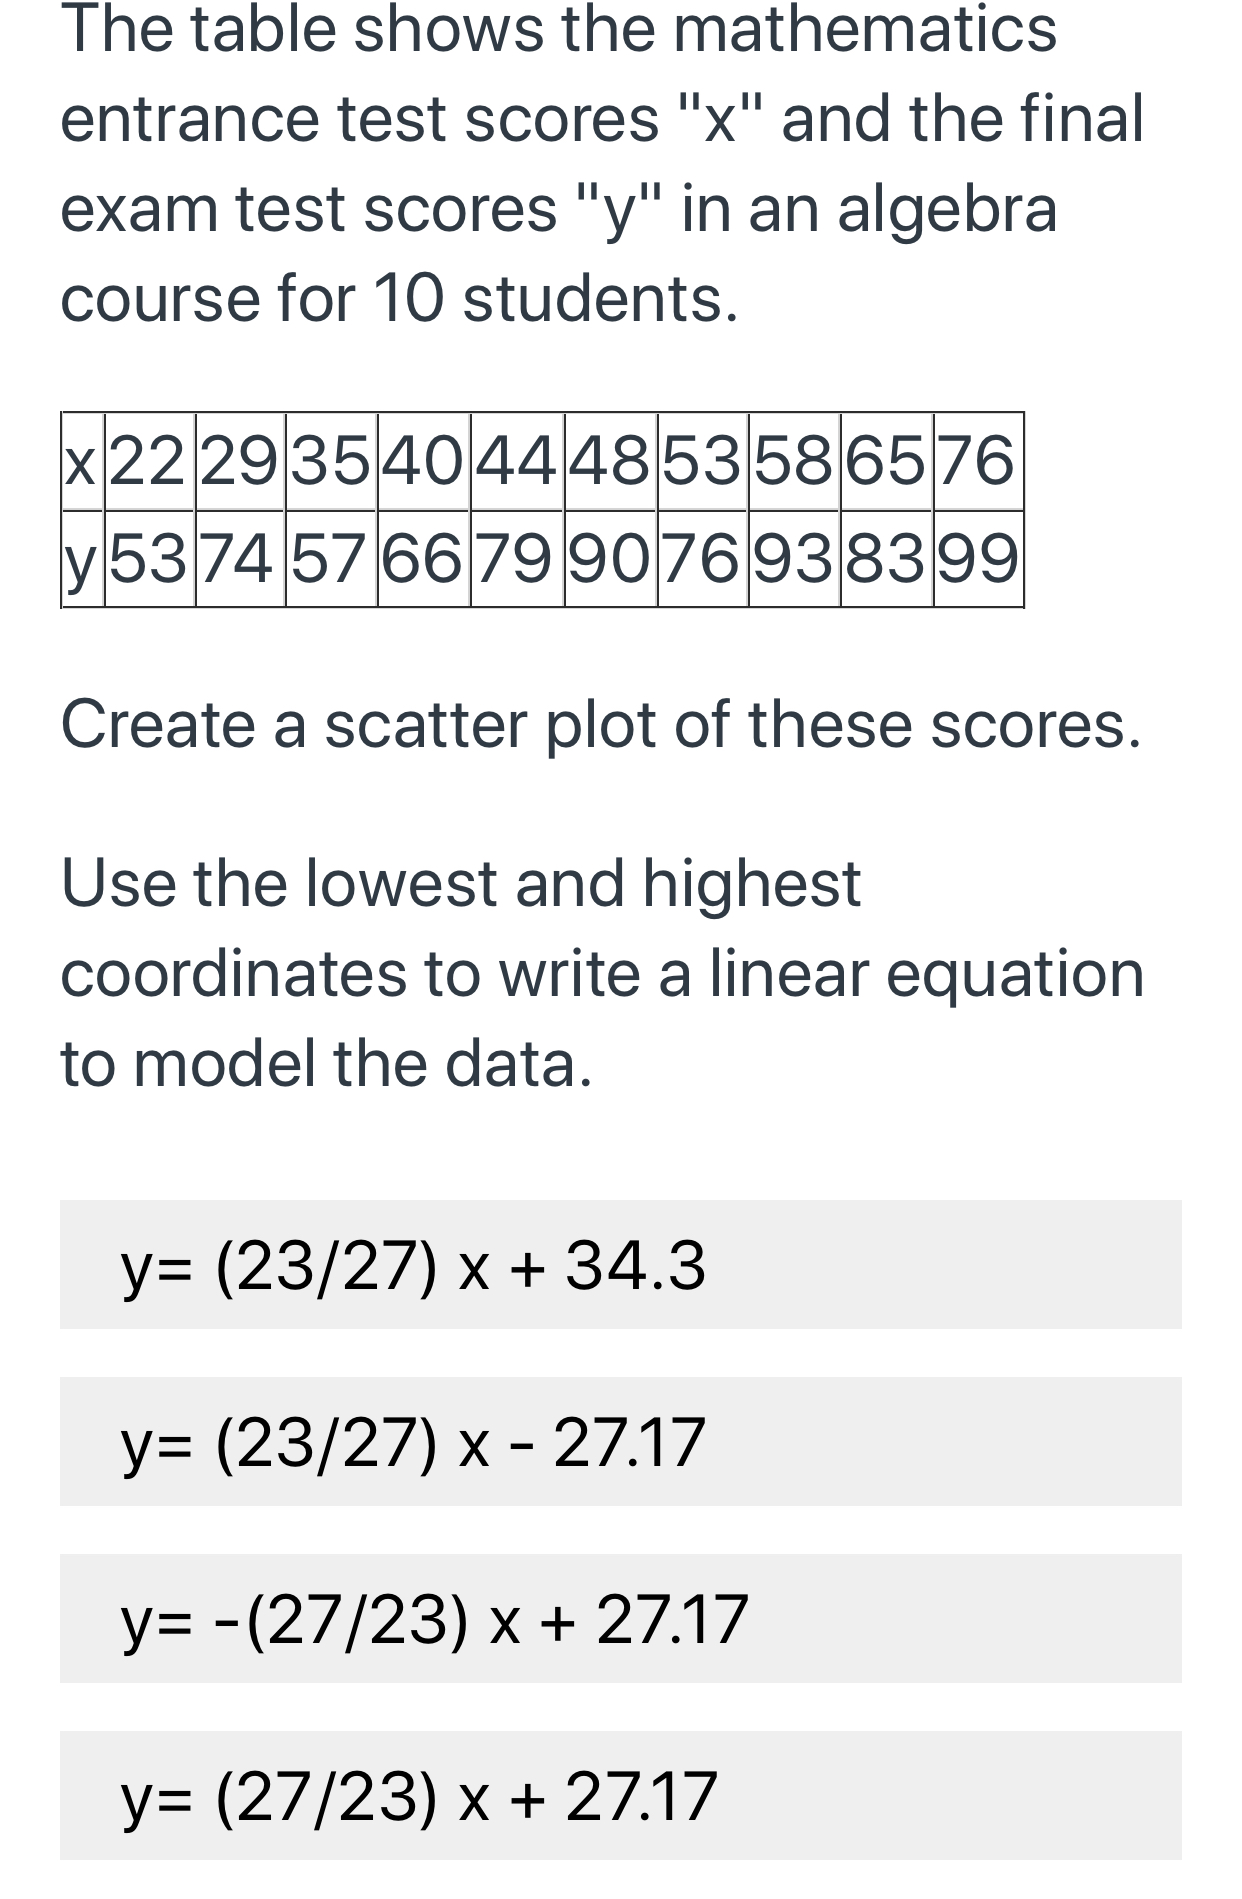
\fThe table shows the mathematics entrance test scores x and the final exam test scores y In an algebra course for 10 students. 522293540444853586576 y5374 576679 90769383@ Create a scatter plot of these scores. Use the lowest and highest coordinates to write a linear equation to model the data. y= (23/27) x + 34.3 y= (23/27) x - 27.17 y= -(27/23) x + 27.17 y: (27/23) x + 27.17
Step by Step Solution
There are 3 Steps involved in it
1 Expert Approved Answer
Step: 1 Unlock

Question Has Been Solved by an Expert!
Get step-by-step solutions from verified subject matter experts
Step: 2 Unlock
Step: 3 Unlock