

Question: Need help finding the CPK and DPMO within excel. Find CP A quality analyst is checking the process capability associated with the production of struts,
Need help finding the CPK and DPMO within excel.
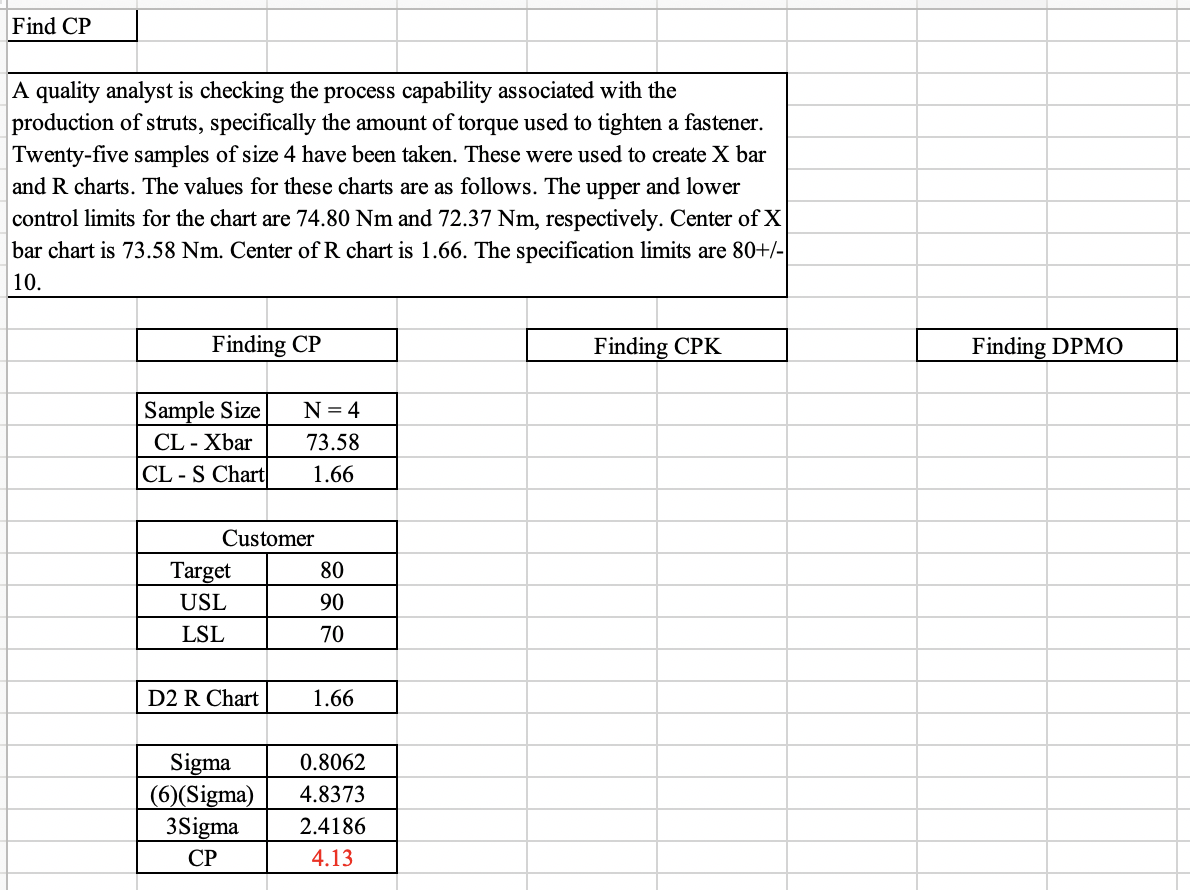
Find CP A quality analyst is checking the process capability associated with the production of struts, specifically the amount of torque used to tighten a fastener. Twenty-five samples of size 4 have been taken. These were used to create X bar and R charts. The values for these charts are as follows. The upper and lower control limits for the chart are 74.80 Nm and 72.37 Nm, respectively. Center of X bar chart is 73.58 Nm. Center of R chart is 1.66. The specification limits are 80+/-| 10. Finding CP Finding CPK Finding DPMO Sample Size CL - Xbar CL-S Chart N=4 73.58 1.66 Customer Target 80 USL 90 LSL 70 D2 R Chart 1.66 Sigma (6)(Sigma) 3Sigma CP 0.8062 4.8373 2.4186 4.13 Find CP A quality analyst is checking the process capability associated with the production of struts, specifically the amount of torque used to tighten a fastener. Twenty-five samples of size 4 have been taken. These were used to create X bar and R charts. The values for these charts are as follows. The upper and lower control limits for the chart are 74.80 Nm and 72.37 Nm, respectively. Center of X bar chart is 73.58 Nm. Center of R chart is 1.66. The specification limits are 80+/-| 10. Finding CP Finding CPK Finding DPMO Sample Size CL - Xbar CL-S Chart N=4 73.58 1.66 Customer Target 80 USL 90 LSL 70 D2 R Chart 1.66 Sigma (6)(Sigma) 3Sigma CP 0.8062 4.8373 2.4186 4.13Step by Step Solution
There are 3 Steps involved in it
1 Expert Approved Answer
Step: 1 Unlock

Question Has Been Solved by an Expert!
Get step-by-step solutions from verified subject matter experts
Step: 2 Unlock
Step: 3 Unlock