

Question: need help finding upper and lower control limit as well, the R-Bar, upper/lower range, and The control limits for the 3-sigma Twelve samples, each containing
need help finding upper and lower control limit as well, the R-Bar, upper/lower range, and The control limits for the
3-sigma
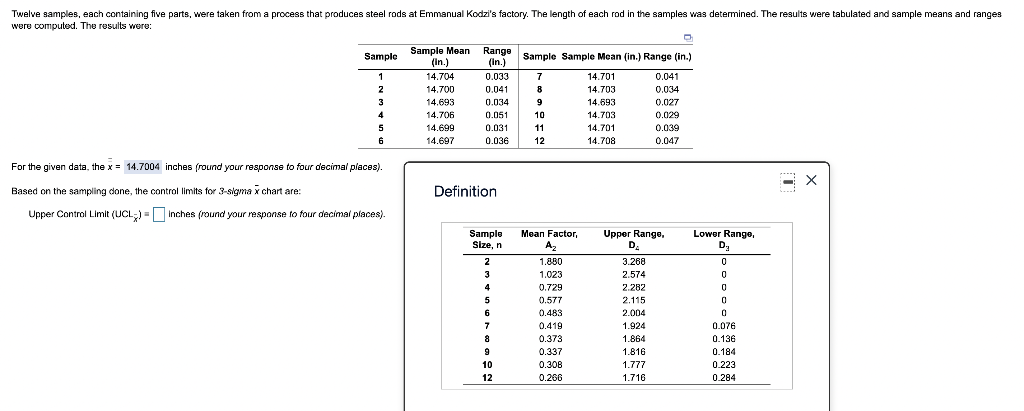
Twelve samples, each containing five parts, were taken from a process that produces steel rods at Emmanual Kodzi's factory. The length of each rod in the samples was determined. The results were tabulated and sample means and ranges were computed. The results were: Sample Sample Sample Mean (in.) Range (in.) 1 2 3 4 5 5 6 Sample Mean (In.) 14.704 14.700 14.693 14.706 14.699 14.697 Range (in.) 0.033 0.041 0.034 0.051 0.031 0.036 7 8 9 10 11 12 14.701 14.703 14.693 14.703 14.701 14.708 0.041 0.034 0.027 0.029 0.039 0.047 For the given data, the x = 14.7004 inches (round your response to four decimal places). Based on the sampling done, the control limits for 3-sigmax chart are: Upper Control Limit (UCL;) - inches (round your response to four decimal places). Definition Sample Size, n 2 3 4 5 6 7 8 Mean Factor, A 1.850 1.023 0.729 0.577 0.483 0.419 0.373 0.337 0.30B 0.266 Upper Range, D 3.268 2.574 2.282 2.115 2.004 1.924 1.864 1.816 1.777 1.716 Lower Range D. 0 0 0 0 o 0.076 0.136 0.184 0.223 0.284 9 10 12Step by Step Solution
There are 3 Steps involved in it
1 Expert Approved Answer
Step: 1 Unlock

Question Has Been Solved by an Expert!
Get step-by-step solutions from verified subject matter experts
Step: 2 Unlock
Step: 3 Unlock