

Question: Need help finishing the excel document please !! (: (provided screenshots of the excel document, formulas, and statements for both companies) You are a bank
Need help finishing the excel document please !! (: (provided screenshots of the excel document, formulas, and statements for both companies)
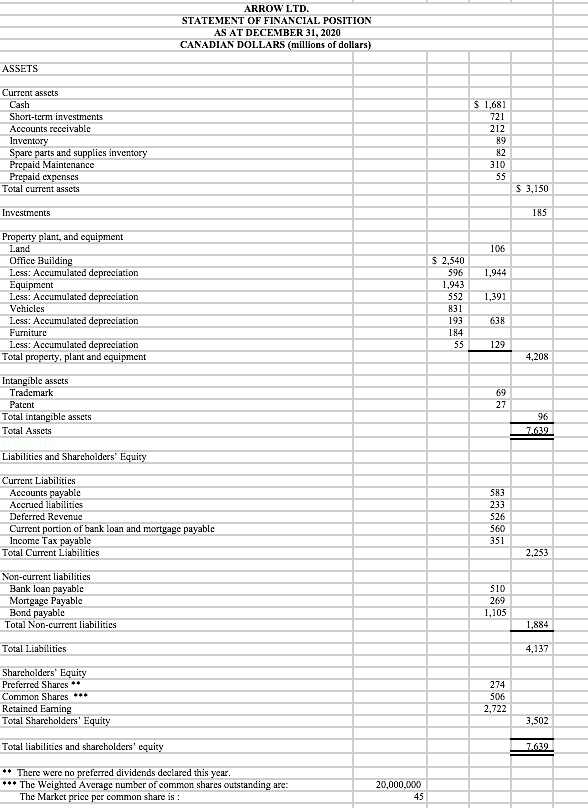
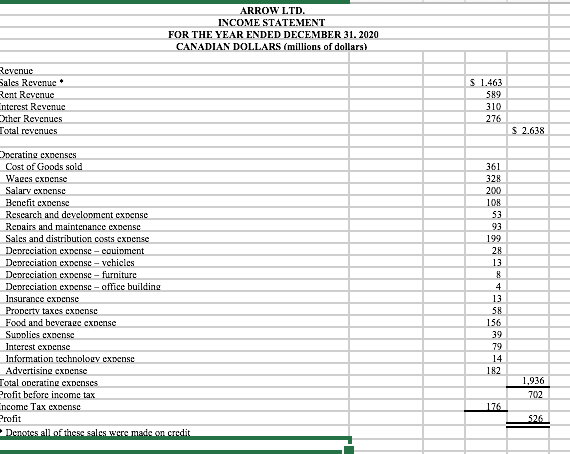
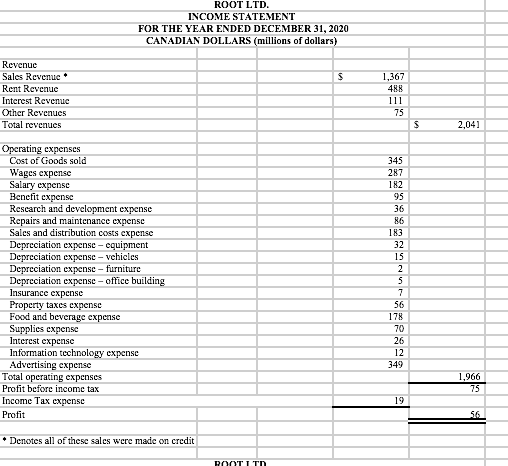
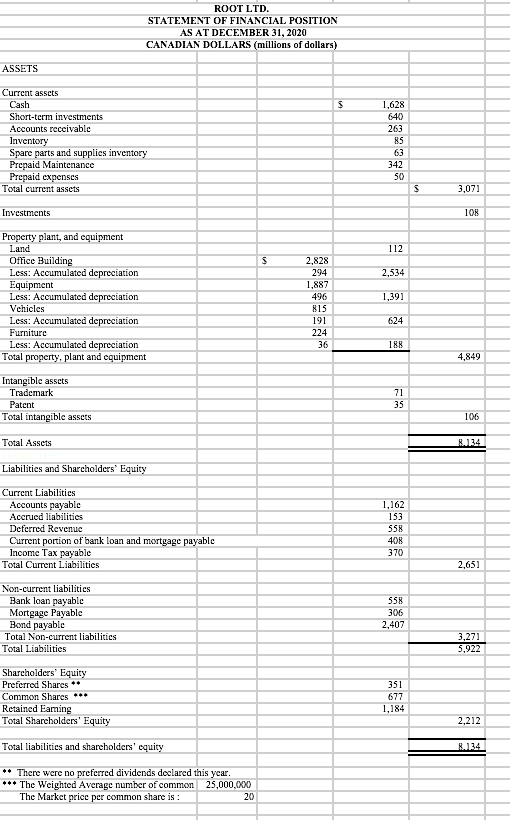
You are a bank loan manager and you have had two companys (Arrow and Root) come to your bank requesting a 6-month loan.
Your instructor will provide you with a Microsoft Excel file that contains the financial statements for 2 companies (Arrow-S and Root-S) and a tab where you will calculate all ratios (Ratio template for students).
There are two parts to this assignment:
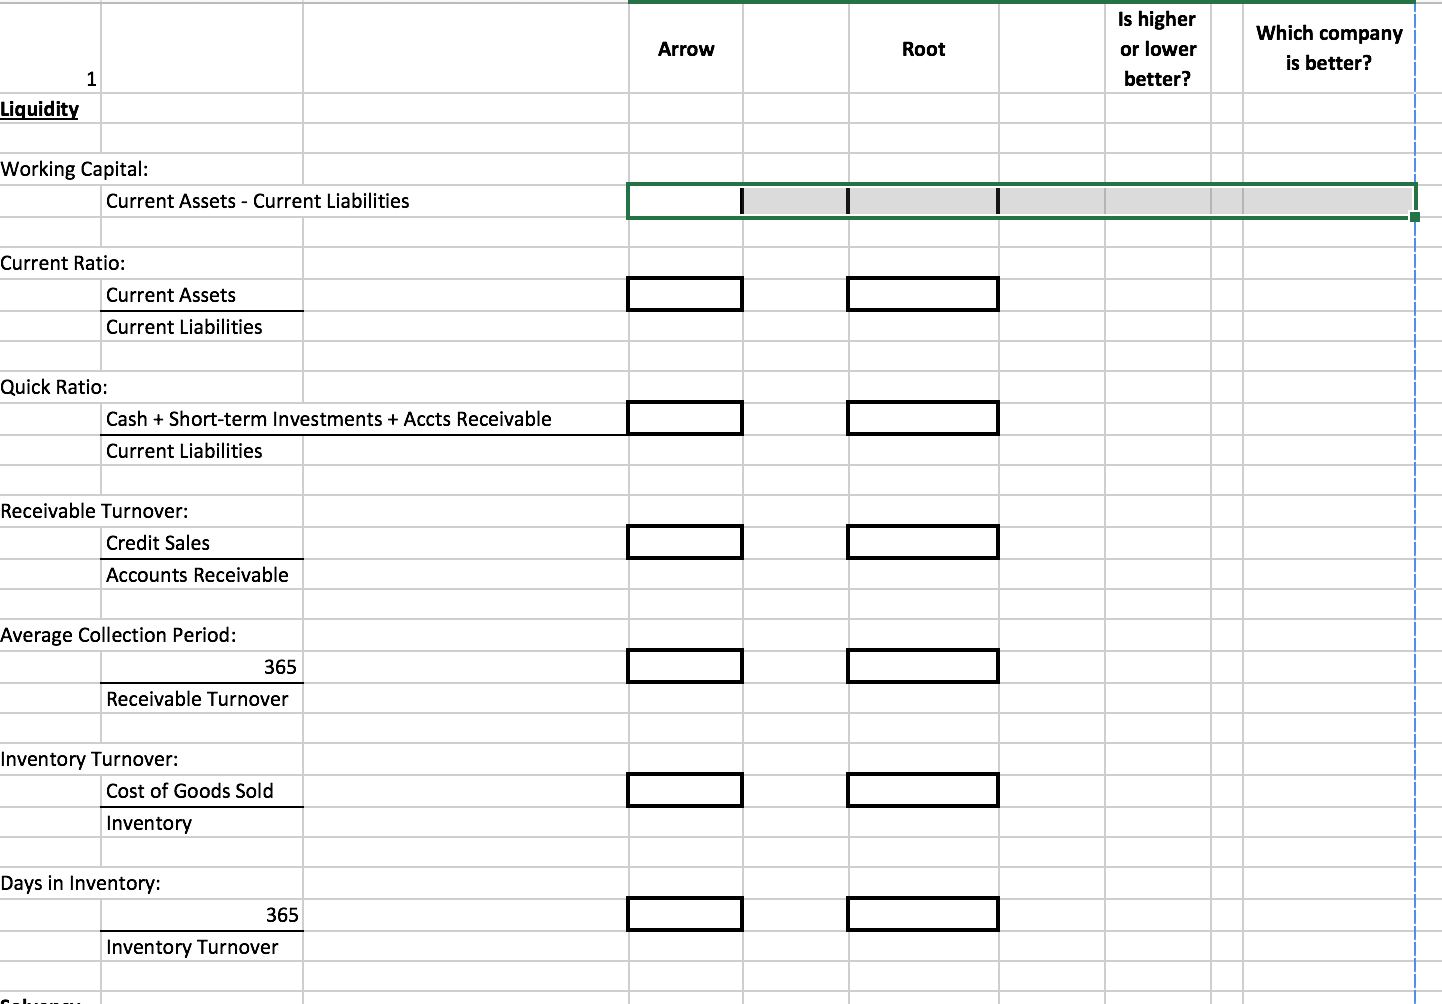
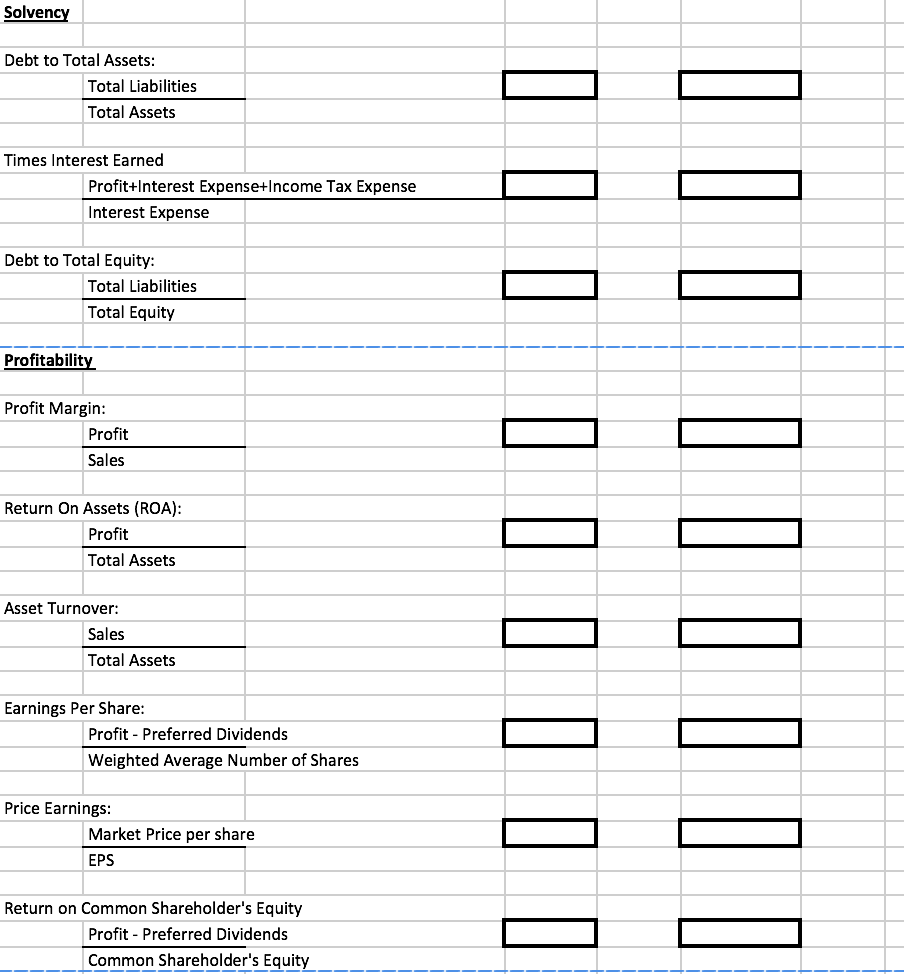
- In the Microsoft Excel file on the Ratio template for students tab you will be calculating Liquidity, Solvency, and Profitability ratios for each company, stating what makes a ratio more successful and comparing the results between the two companies to determine which company has stronger results. (32 marks)
The calculations for Arrow and Root will be completed in columns D and F. Please ensure that you indicate the units for each ratio calculation. For example, if the unit is days, times, :1, record that in columns E and G beside your calculation. Complete all calculations to 2 decimal places. The calculation portion of the assignment must be completed in Microsoft Excel (preferably using linking of cells)
In column H comment on whether the ratio should be higher or lower to be more successful. Please note when comparing the working capital ratios between companies, the companies need to be considered comparable in size. For the purposes of this assignment, assume Arrow and Root are comparable.
In column J comment on which company has a better ratio result based on your calculations. (It may be the same depending on your particular version.)
Formulas:
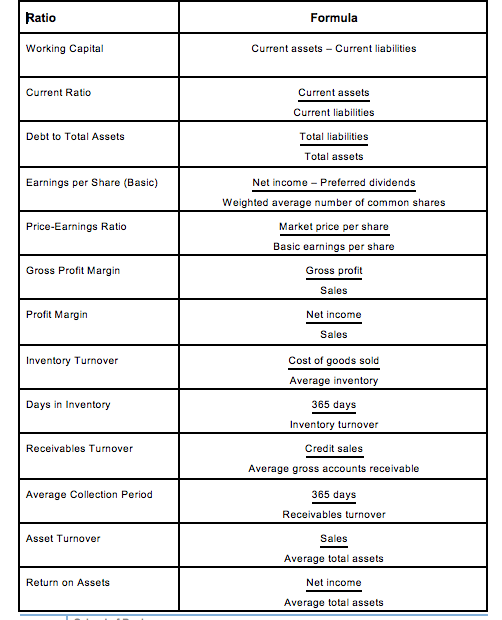
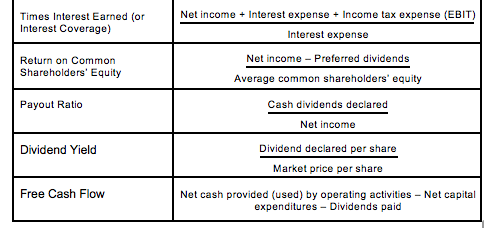
Arrow Root Is higher or lower better? Which company is better? 1 Liquidity Working Capital: Current Assets - Current Liabilities Current Ratio: Current Assets Current Liabilities Quick Ratio: Cash + Short-term Investments + Accts Receivable Current Liabilities Receivable Turnover: Credit Sales Accounts Receivable Average Collection Period: 365 Receivable Turnover Inventory Turnover: Cost of Goods Sold Inventory Days in Inventory: 365 Inventory Turnover Solvency Debt to Total Assets: Total Liabilities Total Assets IT Times Interest Earned Profit+Interest Expense+Income Tax Expense Interest Expense Debt to Total Equity: Total Liabilities Total Equity Profitability Profit Margin: Profit Sales IIIIIII Return On Assets (ROA): Profit Total Assets Asset Turnover: Sales Total Assets Earnings Per Share: Profit - Preferred Dividends Weighted Average Number of Shares Price Earnings: Market Price per share EPS Return on Common Shareholder's Equity Profit - Preferred Dividends Common Shareholder's Equity ARROW LTD. STATEMENT OF FINANCIAL POSITION AS AT DECEMBER 31, 2020 CANADIAN DOLLARS (millions of dollars) ASSETS $ 1,681 721 Current assets Cash Short-term investments Accounts receivable Inventory Spare parts and supplies inventory Prepaid Maintenance Prepaid expenses Total current assets 212 89 82 310 SS $ 3,150 Investments 185 106 1,944 Property plant, and equipment Land Office Building Less: Accumulated depreciation Equipment Less: Accumulated depreciation Vehicles Less: Accumulated depreciation Furniture Less: Accumulated depreciation Total property, plant and equipment 1,391 $ 2,540 596 1,943 552 831 193 184 55 638 129 4,208 Intangible assets Trademark Patent Total intangible assets Total Assets 27 96 7.639 Liabilities and Sharcholders' Equity 583 233 526 560 351 Current Liabilities Accounts payable Accrued liabilities Deferred Revenue Current portion of bank loan and mortgage payable Income Tax payable Total Current Liabilities Non-current liabilities Bank loan payable Mortgage Payable Bond payabic Total Non-current liabilities 2,253 510 269 1,105 1,884 Total Liabilities 4,137 Sharcholders' Equity Preferred Shares Common Shares ... Retained Eaming Total Shareholders' Equity 274 506 2,722 3,502 Total liabilities and shareholders' equity 7.639 ** There were no preferred dividends declared this year. *** The Weighted Average number of common shares outstanding are: The Market price per common share is : 20,000,XX) 45 ARROW LTD INCOME STATEMENT FOR THE YEAR ENDED DECEMBER 31. 2020 CANADIAN DOLLARS (millions of dollars) Revenue Sales Revenue Rent Revenue Interest Revenue ther Revenues Total revenues $ 1.463 589 310 276 S 2.638 Operating exnenses Cost of Goods sold Wages expense Salary exoense Benefit ex ense Rescarch and development exrense Repairs and maintenance exoense Sales and distribution costs expense Depreciation expense-couipment Depreciation expense - vehicles Denreciation expense - furniture Dervreciation cxpense-office building Insurance expense Property taxes expense Food and beverage expense Supplies expense Interest expense Information technology expense Advertising expense Total operating expenses Profit before income tax ncome Tax expense Profit Denates all of these sales were made on credit 361 328 20x) 108 53 93 199 28 13 8 4 13 58 156 39 79 14 182 1,936 702 526 ROOT LTD. INCOME STATEMENT FOR THE YEAR ENDED DECEMBER 31, 2020 CANADIAN DOLLARS (millions of dollars) $ 1,367 488 Revenue Sales Revenue Rent Revenue Interest Revenue Other Revenues Total revenues 111 75 $ 2,041 345 Operating expenses Cost of Goods sold Wages expense Salary expense Benefit expense Research and development expense Repairs and maintenance expense Sales and distribution costs expense Depreciation expense - equipment Depreciation expense - vehicles Depreciation expense - furniture Depreciation expense-office building Insurance expense Property taxes expense Food and beverage expense Supplies expense Interest expense Information technology expense Advertising expense Total operating expenses Profit before income tax Income Tax expense Profit 287 182 95 36 86 183 32 15 2 5 7 56 178 70 26 12 349 1,966 75 19 Denotes all of these sales were made on credit ROOT IT ROOT LTD. STATEMENT OF FINANCIAL POSITION AS AT DECEMBER 31, 2020 CANADIAN DOLLARS (millions of dollars) ASSETS s Current assets Cash Short-term investments Accounts receivablc Inventory Spare parts and supplies inventory Prepaid Maintenance Prepaid expenses Total current assets 1,628 640 263 85 63 342 50 s 3,071 Investments 108 112 s 2,534 Property plant, and equipment Land Office Building Less: Accumulated depreciation Equipment Less: Accumulated depreciation Vehicles Less: Accumulated depreciation Furniture Less: Accumulated depreciation Total property, plant and equipment 1,391 2,828 294 1,887 496 815 191 224 36 624 188 4,849 Intangible assets Trademark Patent Total intangible assets 71 35 106 Total Assets 8.134 Liabilities and Shareholders' Equity 1,162 Current Liabilities Accounts payable Accrued liabilities Deferred Revenue Current portion of bank loan and mortgage payable Income Tax payable Total Current Liabilities 153 558 408 370 2,651 Non-current liabilities Bank loan payable Mortgage Payable Bond payable Total Non-current liabilities Total Liabilities SS8 306 2,407 3,271 5,922 Shareholders' Equity Preferred Shares *. Common Shares ... Retained Eaming Total Shareholders' Equity 351 677 1,184 2,212 Total liabilities and shareholders' cquity ** There were no preferred dividends declared this year. *** The Weighted Average number of common 25,000.00 The Market price per common share is : 20 Ratio Formula Working Capital Current assets - Current liabilities Current Ratio Debt to Total Assets Earnings per Share (Basic) Price-Earnings Ratio Gross Profit margin Current assets Current liabilities Total liabilities Total assets Net income - Preferred dividends Weighted average number of common shares Market price per share Basic earnings per share Gross profit Sales Net income Sales Cost of goods sold Average inventory 365 days Inventory turnover Credit sales Average gross accounts receivable 365 days Receivables turnover Profit Margin Inventory Turnover Days in Inventory Receivables Turnover Average Collection Period Asset Turnover Sales Average total assets Return on Assets Net income Average total assets Net income + Interest expense + Income tax expense (EBIT) Times Interest Earned (or Interest Coverage) Interest expense Return on Common Shareholders' Equity Payout Ratio Net income - Preferred dividends Average common shareholders' equity Cash dividends declared Net income Dividend declared per share Market price per share Dividend Yield Free Cash Flow Net cash provided (used) by operating activities - Net capital expenditures - Dividends paid Arrow Root Is higher or lower better? Which company is better? 1 Liquidity Working Capital: Current Assets - Current Liabilities Current Ratio: Current Assets Current Liabilities Quick Ratio: Cash + Short-term Investments + Accts Receivable Current Liabilities Receivable Turnover: Credit Sales Accounts Receivable Average Collection Period: 365 Receivable Turnover Inventory Turnover: Cost of Goods Sold Inventory Days in Inventory: 365 Inventory Turnover Solvency Debt to Total Assets: Total Liabilities Total Assets IT Times Interest Earned Profit+Interest Expense+Income Tax Expense Interest Expense Debt to Total Equity: Total Liabilities Total Equity Profitability Profit Margin: Profit Sales IIIIIII Return On Assets (ROA): Profit Total Assets Asset Turnover: Sales Total Assets Earnings Per Share: Profit - Preferred Dividends Weighted Average Number of Shares Price Earnings: Market Price per share EPS Return on Common Shareholder's Equity Profit - Preferred Dividends Common Shareholder's Equity ARROW LTD. STATEMENT OF FINANCIAL POSITION AS AT DECEMBER 31, 2020 CANADIAN DOLLARS (millions of dollars) ASSETS $ 1,681 721 Current assets Cash Short-term investments Accounts receivable Inventory Spare parts and supplies inventory Prepaid Maintenance Prepaid expenses Total current assets 212 89 82 310 SS $ 3,150 Investments 185 106 1,944 Property plant, and equipment Land Office Building Less: Accumulated depreciation Equipment Less: Accumulated depreciation Vehicles Less: Accumulated depreciation Furniture Less: Accumulated depreciation Total property, plant and equipment 1,391 $ 2,540 596 1,943 552 831 193 184 55 638 129 4,208 Intangible assets Trademark Patent Total intangible assets Total Assets 27 96 7.639 Liabilities and Sharcholders' Equity 583 233 526 560 351 Current Liabilities Accounts payable Accrued liabilities Deferred Revenue Current portion of bank loan and mortgage payable Income Tax payable Total Current Liabilities Non-current liabilities Bank loan payable Mortgage Payable Bond payabic Total Non-current liabilities 2,253 510 269 1,105 1,884 Total Liabilities 4,137 Sharcholders' Equity Preferred Shares Common Shares ... Retained Eaming Total Shareholders' Equity 274 506 2,722 3,502 Total liabilities and shareholders' equity 7.639 ** There were no preferred dividends declared this year. *** The Weighted Average number of common shares outstanding are: The Market price per common share is : 20,000,XX) 45 ARROW LTD INCOME STATEMENT FOR THE YEAR ENDED DECEMBER 31. 2020 CANADIAN DOLLARS (millions of dollars) Revenue Sales Revenue Rent Revenue Interest Revenue ther Revenues Total revenues $ 1.463 589 310 276 S 2.638 Operating exnenses Cost of Goods sold Wages expense Salary exoense Benefit ex ense Rescarch and development exrense Repairs and maintenance exoense Sales and distribution costs expense Depreciation expense-couipment Depreciation expense - vehicles Denreciation expense - furniture Dervreciation cxpense-office building Insurance expense Property taxes expense Food and beverage expense Supplies expense Interest expense Information technology expense Advertising expense Total operating expenses Profit before income tax ncome Tax expense Profit Denates all of these sales were made on credit 361 328 20x) 108 53 93 199 28 13 8 4 13 58 156 39 79 14 182 1,936 702 526 ROOT LTD. INCOME STATEMENT FOR THE YEAR ENDED DECEMBER 31, 2020 CANADIAN DOLLARS (millions of dollars) $ 1,367 488 Revenue Sales Revenue Rent Revenue Interest Revenue Other Revenues Total revenues 111 75 $ 2,041 345 Operating expenses Cost of Goods sold Wages expense Salary expense Benefit expense Research and development expense Repairs and maintenance expense Sales and distribution costs expense Depreciation expense - equipment Depreciation expense - vehicles Depreciation expense - furniture Depreciation expense-office building Insurance expense Property taxes expense Food and beverage expense Supplies expense Interest expense Information technology expense Advertising expense Total operating expenses Profit before income tax Income Tax expense Profit 287 182 95 36 86 183 32 15 2 5 7 56 178 70 26 12 349 1,966 75 19 Denotes all of these sales were made on credit ROOT IT ROOT LTD. STATEMENT OF FINANCIAL POSITION AS AT DECEMBER 31, 2020 CANADIAN DOLLARS (millions of dollars) ASSETS s Current assets Cash Short-term investments Accounts receivablc Inventory Spare parts and supplies inventory Prepaid Maintenance Prepaid expenses Total current assets 1,628 640 263 85 63 342 50 s 3,071 Investments 108 112 s 2,534 Property plant, and equipment Land Office Building Less: Accumulated depreciation Equipment Less: Accumulated depreciation Vehicles Less: Accumulated depreciation Furniture Less: Accumulated depreciation Total property, plant and equipment 1,391 2,828 294 1,887 496 815 191 224 36 624 188 4,849 Intangible assets Trademark Patent Total intangible assets 71 35 106 Total Assets 8.134 Liabilities and Shareholders' Equity 1,162 Current Liabilities Accounts payable Accrued liabilities Deferred Revenue Current portion of bank loan and mortgage payable Income Tax payable Total Current Liabilities 153 558 408 370 2,651 Non-current liabilities Bank loan payable Mortgage Payable Bond payable Total Non-current liabilities Total Liabilities SS8 306 2,407 3,271 5,922 Shareholders' Equity Preferred Shares *. Common Shares ... Retained Eaming Total Shareholders' Equity 351 677 1,184 2,212 Total liabilities and shareholders' cquity ** There were no preferred dividends declared this year. *** The Weighted Average number of common 25,000.00 The Market price per common share is : 20 Ratio Formula Working Capital Current assets - Current liabilities Current Ratio Debt to Total Assets Earnings per Share (Basic) Price-Earnings Ratio Gross Profit margin Current assets Current liabilities Total liabilities Total assets Net income - Preferred dividends Weighted average number of common shares Market price per share Basic earnings per share Gross profit Sales Net income Sales Cost of goods sold Average inventory 365 days Inventory turnover Credit sales Average gross accounts receivable 365 days Receivables turnover Profit Margin Inventory Turnover Days in Inventory Receivables Turnover Average Collection Period Asset Turnover Sales Average total assets Return on Assets Net income Average total assets Net income + Interest expense + Income tax expense (EBIT) Times Interest Earned (or Interest Coverage) Interest expense Return on Common Shareholders' Equity Payout Ratio Net income - Preferred dividends Average common shareholders' equity Cash dividends declared Net income Dividend declared per share Market price per share Dividend Yield Free Cash Flow Net cash provided (used) by operating activities - Net capital expenditures - Dividends paid
Step by Step Solution
There are 3 Steps involved in it

Get step-by-step solutions from verified subject matter experts