

Question: need help for this exercise quickly if it's possible please!!! thank you Finance Nagy and Szabo are two companies that operate several hypermarkets. You are
need help for this exercise quickly if it's possible please!!!
thank you
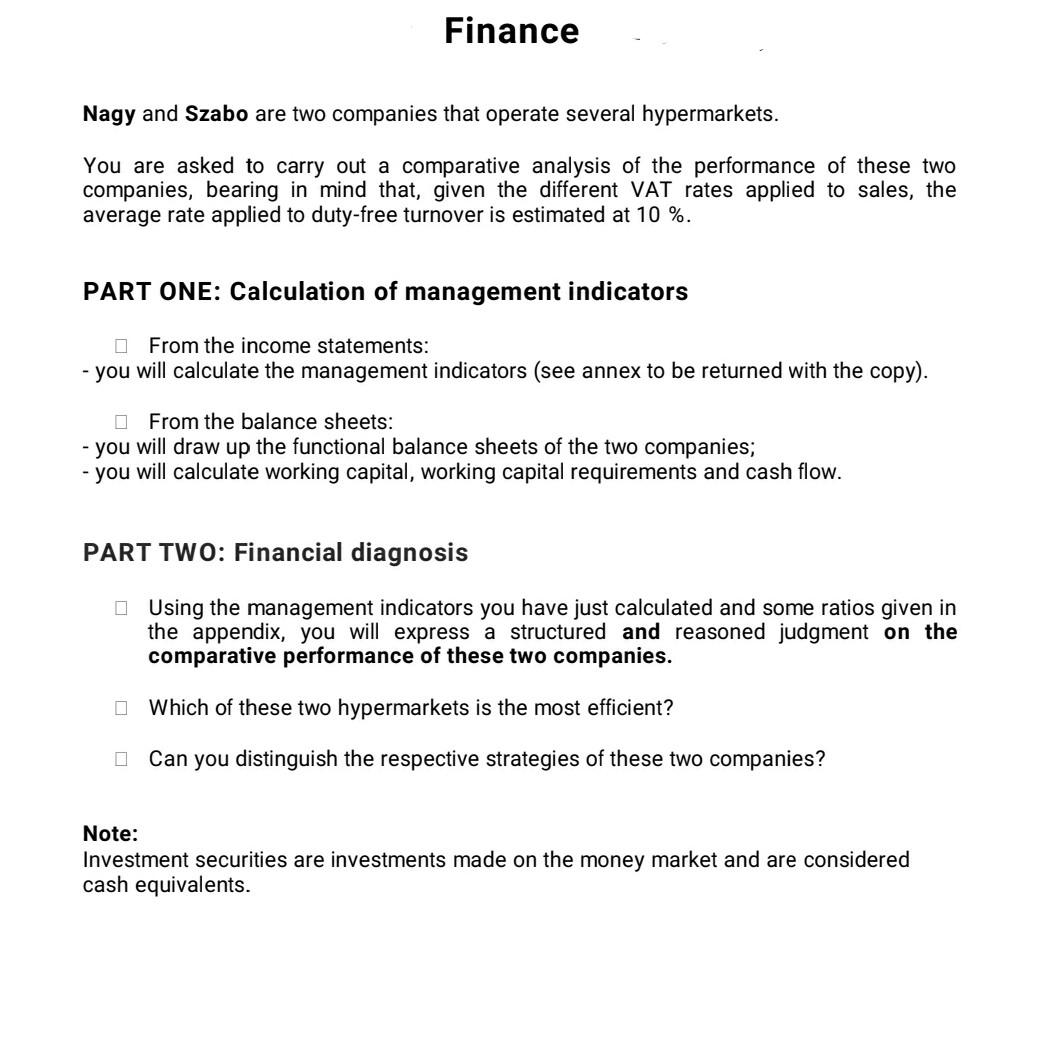
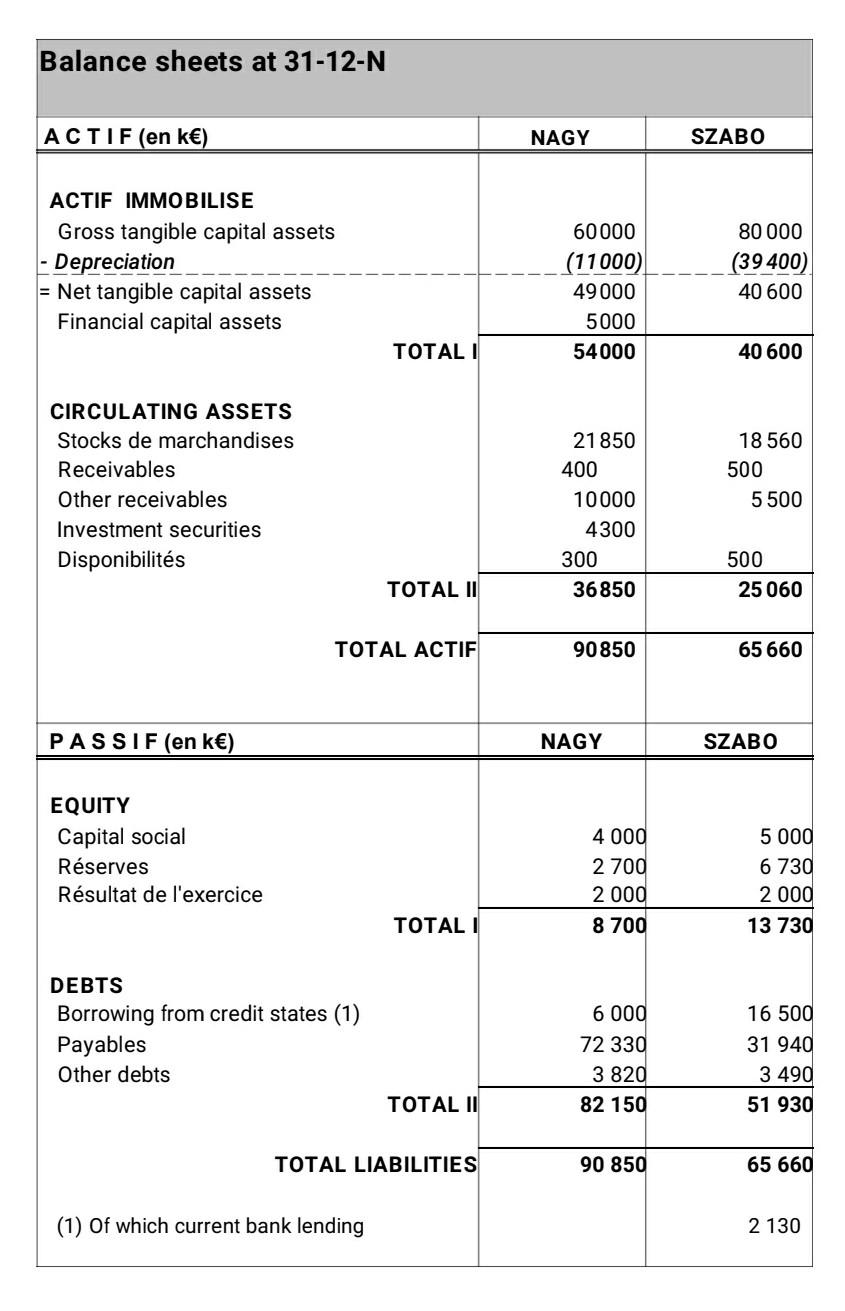
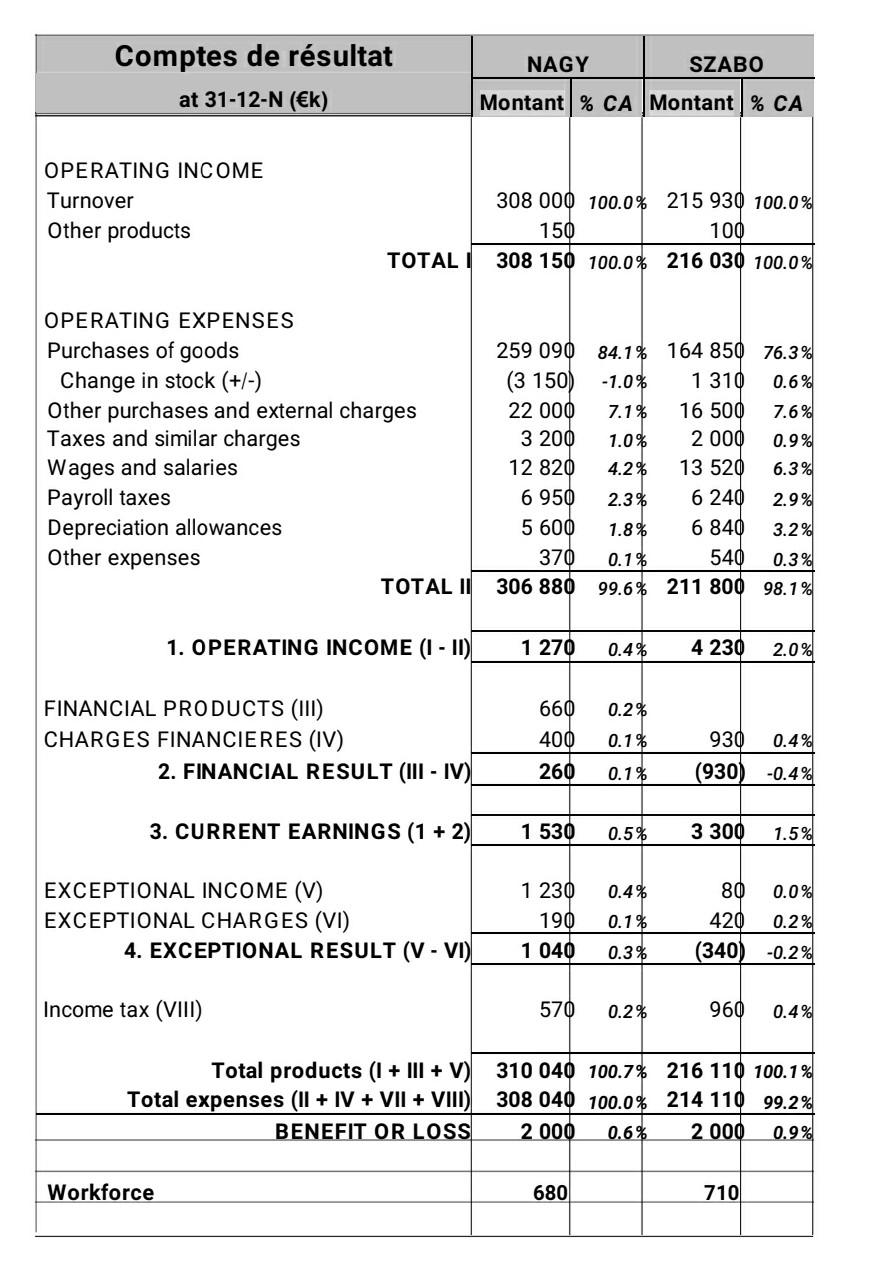
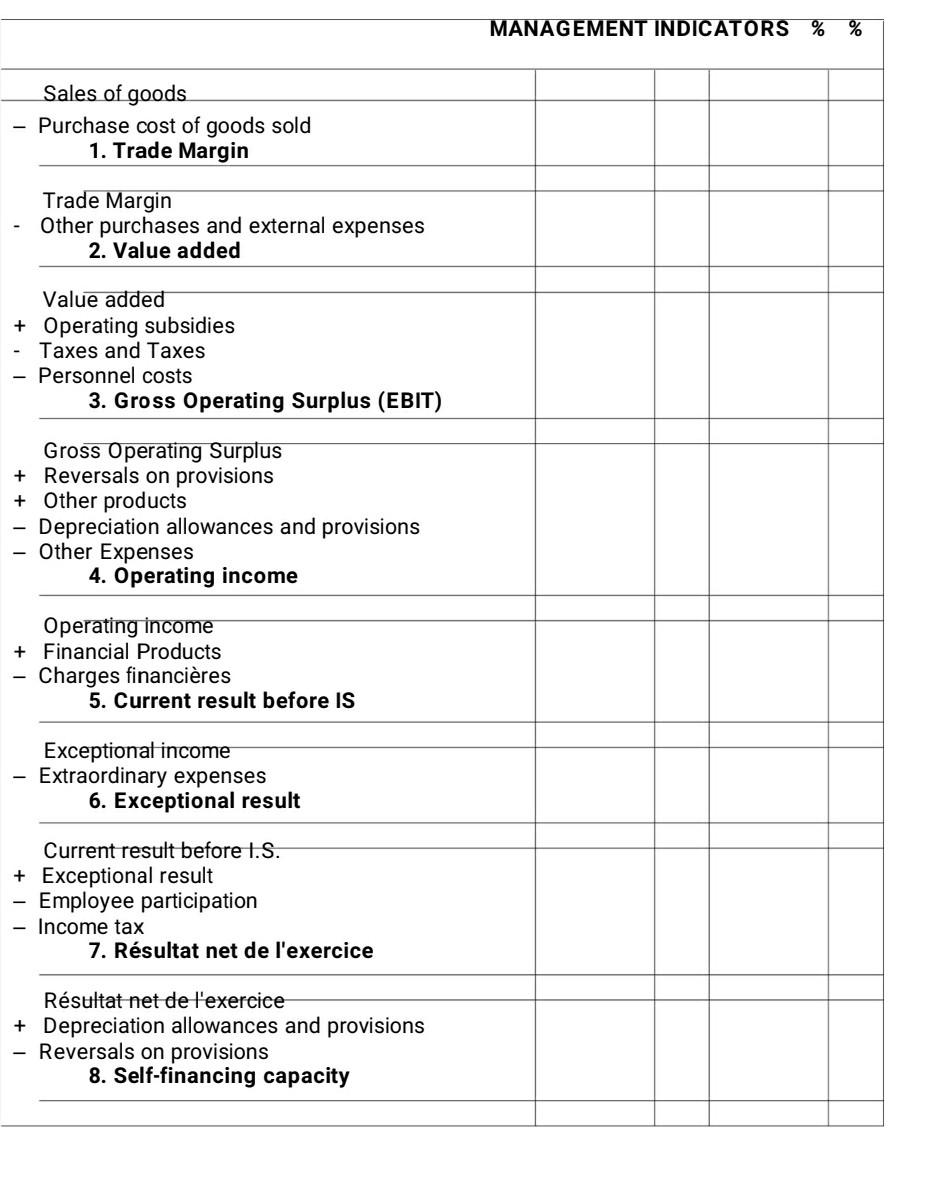
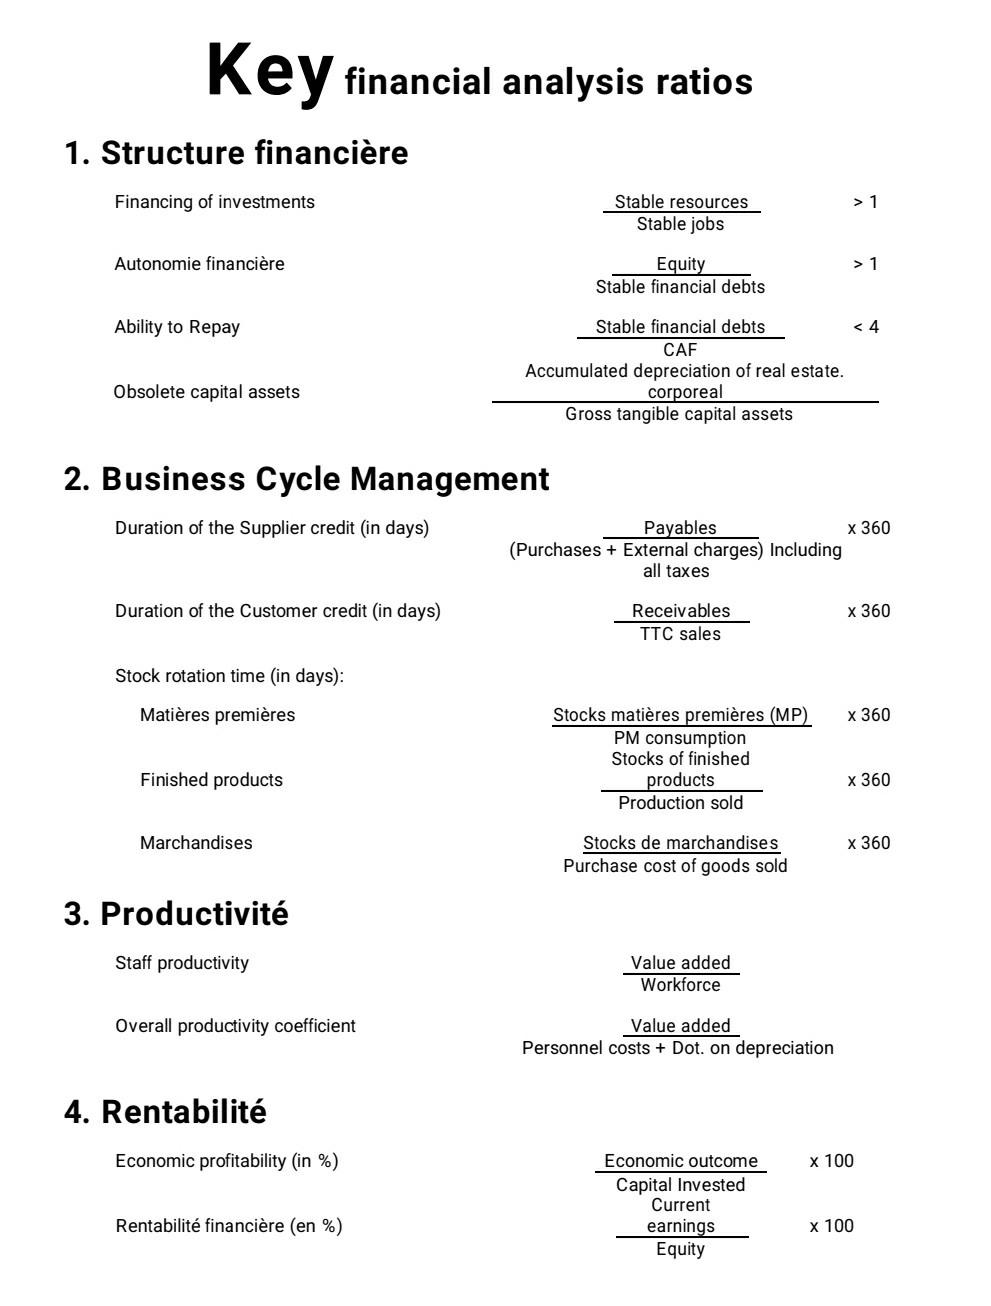
Finance Nagy and Szabo are two companies that operate several hypermarkets. You are asked to carry out a comparative analysis of the performance of these two companies, bearing in mind that, given the different VAT rates applied to sales, the average rate applied to duty-free turnover is estimated at 10 %. PART ONE: Calculation of management indicators . From the income statements: - you will calculate the management indicators (see annex to be returned with the copy). From the balance sheets: - you will draw up the functional balance sheets of the two companies; - you will calculate working capital, working capital requirements and cash flow. PART TWO: Financial diagnosis Using the management indicators you have just calculated and some ratios given in the appendix, you will express a structured and reasoned judgment on the comparative performance of these two companies. . Which of these two hypermarkets is the most efficient? I Can you distinguish the respective strategies of these two companies? Note: Investment securities are investments made on the money market and are considered cash equivalents. Balance sheets at 31-12-N ACTIF (en k) NAGY SZABO ACTIF IMMOBILISE Gross tangible capital assets Depreciation = Net tangible capital assets Financial capital assets 60000 (11000) 49000 5000 54000 80 000 (39400) 40 600 TOTALT 40 600 CIRCULATING ASSETS Stocks de marchandises Receivables Other receivables Investment securities Disponibilits 18560 500 5500 21 850 400 10000 4300 300 36850 500 25060 TOTAL II TOTAL ACTIF 90850 65 660 PASSIF (en k) NAGY SZABO EQUITY Capital social Rserves Rsultat de l'exercice 4000 2 700 2000 8 700 5 000 6 730 2 000 13 730 TOTALI DEBTS Borrowing from credit states (1) Payables Other debts 6 000 72 330 3 820 82 150 16 500 31 940 3 490 51 930 TOTAL 11 TOTAL LIABILITIES 90 850 65 660 (1) of which current bank lending 2 130 Comptes de rsultat NAGY SZABO at 31-12-N () Montant % CA Montant % CA OPERATING INCOME Turnover Other products 308 000 100.0% 215 930 100.0% 150 100 308 150 100.0% 216 030 100.0% TOTAL I OPERATING EXPENSES Purchases of goods Change in stock (+/-) Other purchases and external charges Taxes and similar charges Wages and salaries Payroll taxes Depreciation allowances Other expenses TOTAL II 259 090 (3 150 22 000 3 200 12 820 6 950 5 600 84.1% 164 850 76.3% -1.0% 1 310 0.6% 7.1% 16 500 7.6% 1.0% 2 000 0.9% 4.2% 13 520 6.3% 2.3% 6 240 2.9% 1.8% 6 840 3.2% 0.1% 540 0.3% 99.6% 211 800 98.1% 370 306 880 1. OPERATING INCOME (1-11) 1 270 0.4% 4230 2.0% 0.2% FINANCIAL PRODUCTS (III) CHARGES FINANCIERES (IV) 2. FINANCIAL RESULT (III - IV) 660 400 0.1% 0.4% 930 (930 260 0.1% -0.4% 3. CURRENT EARNINGS (1 + 2) 1 530 0.5% 3 300 1.5% 0.4% 0.0% EXCEPTIONAL INCOME (V) EXCEPTIONAL CHARGES (VI) 4. EXCEPTIONAL RESULT (V - VI) 1 230 190 1 040 0.1% 80 420 (340 0.2% 0.3% -0.2% Income tax (VIII) 570 0.2% 960 0.4% Total products (I + III + V) Total expenses (Il + IV + VII + VIII) BENEFIT OR LOSS 310 040 100.7% 216 110 100.1% 308 040 100.0% 214 110 99.2% 2 000 0.6% 2 000 0.9% Workforce 6801 7100 MANAGEMENT INDICATORS % % Sales of goods Purchase cost of goods sold 1. Trade Margin Trade Margin Other purchases and external expenses 2. Value added Value added + Operating subsidies Taxes and Taxes Personnel costs 3. Gross Operating Surplus (EBIT) Gross Operating Surplus + Reversals on provisions + Other products Depreciation allowances and provisions Other Expenses 4. Operating income Operating income + Financial Products Charges financires 5. Current result before IS Exceptional income Extraordinary expenses 6. Exceptional result Current result before I.S. + Exceptional result Employee participation - Income tax 7. Rsultat net de l'exercice Rsultat net de l'exercice + Depreciation allowances and provisions Reversals on provisions 8. Self-financing capacity Key financial analysis ratios 1. Structure financire Financing of investments > 1 Stable resources Stable jobs Autonomie financire > 1 Equity Stable financial debts Ability to Repay Stable financial debts
Step by Step Solution
There are 3 Steps involved in it

Get step-by-step solutions from verified subject matter experts