

Question: Need help graphing the following question and perhaps explanation for the multiple choice Click on the icon to study the Economics in the News article
Need help graphing the following question and perhaps explanation for the multiple choice
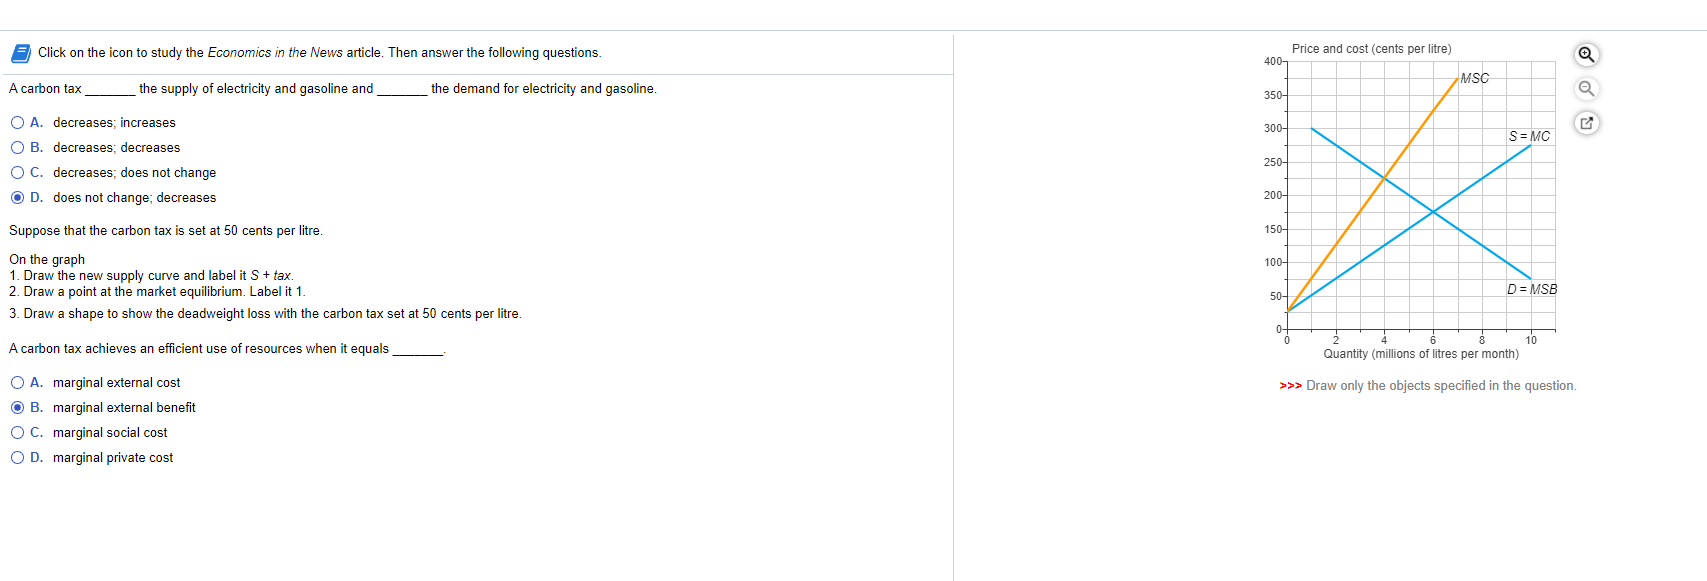
Click on the icon to study the Economics in the News article Then answer the following questions. Price and cost (cents per litre) A carbon tax the supply of electricity and gasoline and the demand for electricity and gasoline O A. decreases; increases C) B. decreases; decreases O C. decreases; does not change @ D. does not change; decreases Suppose that the carbon tax is set at SO cents per litre On the graph 1. Draw the new supply curve and label it S + tax. 2. Draw a point at the market equilibrium. Label it 1. 3. Draw a shape to show the deadweight loss with the carbon tax set at 50 cents per litre. A carbon tax achieves an efficient use of resources when it equals marginal external cost marginal external benefit marginal social cost marginal private cost s Quantity (millions of "tres per month) c >>> Draw only the objects specified in the questiom
Step by Step Solution
There are 3 Steps involved in it

Get step-by-step solutions from verified subject matter experts