

Question: Need help! How to calculate this problem, please show the steps, thank you! The historical performance data of Macquarie Fund, Miranda Fund and market portfolio
 Need help! How to calculate this problem, please show the steps, thank you!
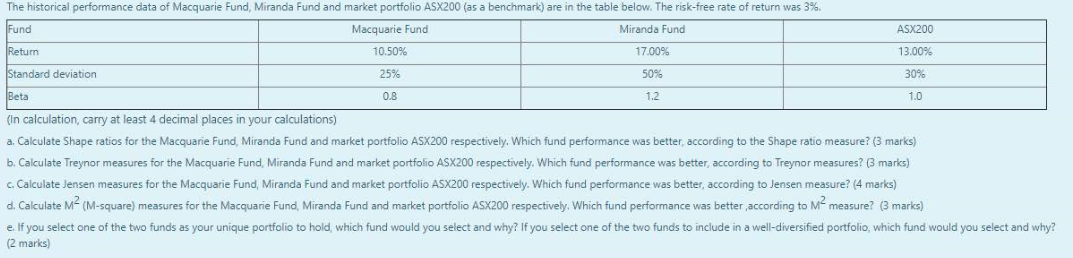
The historical performance data of Macquarie Fund, Miranda Fund and market portfolio ASX200 (as a benchmark) are in the table below. The risk-free rate of return was 3% Fund Macquarie Fund Miranda Fund Retum 10.50% 17.00% ASX200 13.00% Standard deviation 25% 50% 30% Beta 0.8 1.2 1.0 (In calculation, carry at least 4 decimal places in your calculations) a. Calculate Shape ratios for the Macquarie Fund, Miranda Fund and market portfolio ASX200 respectively. Which fund performance was better according to the Shape ratio measure? (3 marks) b. Calculate Treynor measures for the Macquarie Fund, Miranda Fund and market portfolio ASX200 respectively. Which fund performance was better, according to Treynor measures? (3 marks) c. Calculate Jensen measures for the Macquarie Fund, Miranda Fund and market portfolio ASX200 respectively. Which fund performance was better according to Jensen measure? (4 marks) d. Calculate M2 (M-square) measures for the Macquarie Fund, Miranda Fund and market portfolio ASX200 respectively. Which fund performance was better according to M2 measure? (3 marks) e. If you select one of the two funds as your unique portfolio to hold, which fund would you select and why? If you select one of the two funds to include in a well-diversified portfolio, which fund would you select and why? (2 marks)
Step by Step Solution
There are 3 Steps involved in it

Get step-by-step solutions from verified subject matter experts