

Question: need help in this probability and statistic question with steps, thank yoy The final marks of 21 students were recorded and the sample data are
need help in this probability and statistic question with steps, thank yoy
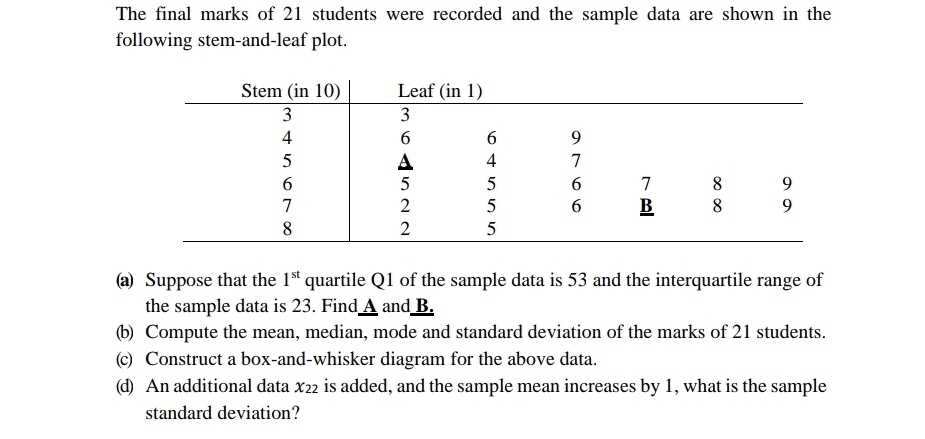
The final marks of 21 students were recorded and the sample data are shown in the following stemandleaf plot. Stem (in 10) Leaf (in 1) 3 3 4 6 9 5 A 4 T 6 5 5 6 7 3 9 T 2 5 6 8 9 8 2 5 (5) Suppose that the 1st quartile Q1 of the sample data is 53 and the interquartile range of the sample data is 23. Find A and; {b} Compute the mean, median, mode and standard deviation of the marks of 21 students. {0) Construct a hoxandwhisker diagram for the above data. {d} An additional data 2522 is added, and the sample mean increases by 1, what is the sample stande de'viation
Step by Step Solution
There are 3 Steps involved in it
1 Expert Approved Answer
Step: 1 Unlock

Question Has Been Solved by an Expert!
Get step-by-step solutions from verified subject matter experts
Step: 2 Unlock
Step: 3 Unlock