

Question: Need Help in this question Question 4: Consider two risky assets with prices S1 (0) = 100, S2(0) = 150 the price is: (80, 250)
Need Help in this question
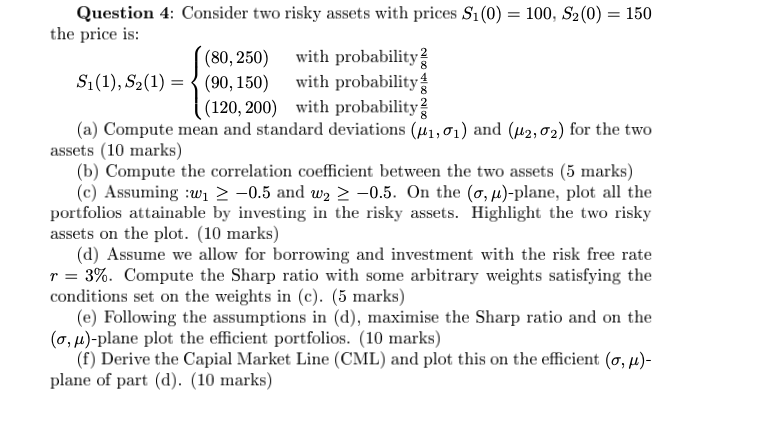
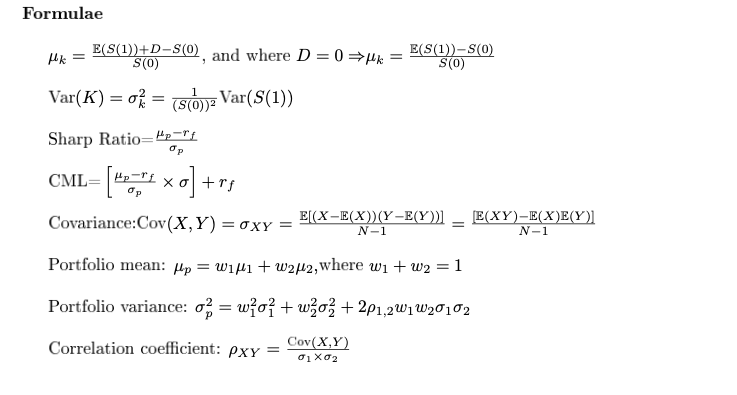
Question 4: Consider two risky assets with prices S1 (0) = 100, S2(0) = 150 the price is: (80, 250) with probability S1 (1), S2(1) = (90, 150) with probability (120, 200) with probability (a) Compute mean and standard deviations (#1,01) and (#2, 02) for the two assets (10 marks) (b) Compute the correlation coefficient between the two assets (5 marks) (c) Assuming :w1 2 -0.5 and w2 2 -0.5. On the (o, p)-plane, plot all the portfolios attainable by investing in the risky assets. Highlight the two risky assets on the plot. (10 marks) (d) Assume we allow for borrowing and investment with the risk free rate r = 3%. Compute the Sharp ratio with some arbitrary weights satisfying the conditions set on the weights in (c). (5 marks) (e) Following the assumptions in (d), maximise the Sharp ratio and on the (0, A)-plane plot the efficient portfolios. (10 marks) (f) Derive the Capial Market Line (CML) and plot this on the efficient (o, /)- plane of part (d). (10 marks)Formulae E(S(1))+D-S(0) E(S(]))-S(0) S(0) -, and where D = 0 = = S(0) Var (K ) = OK = 1 (S(0) ) 2 Var(S(1)) Sharp Ratio=Ap-" CML= Op Covariance: Cov (X, Y) = OXY = E(X-E(X))(Y-E(Y))] [E(XY)-E(X)E(Y) N-1 N-1 Portfolio mean: Mp = will + w2/2, where wi + w2 = 1 Portfolio variance: o? = who; + who? + 2p1,2w1w20102 Correlation coefficient: PXY = Cov( X, Y) 01X02
Step by Step Solution
There are 3 Steps involved in it

Get step-by-step solutions from verified subject matter experts