

Question: need help on making this graphs following requirements . Activity 2: Determine the Reaction Rate in the Presence or Absence of an Enzyme Using the
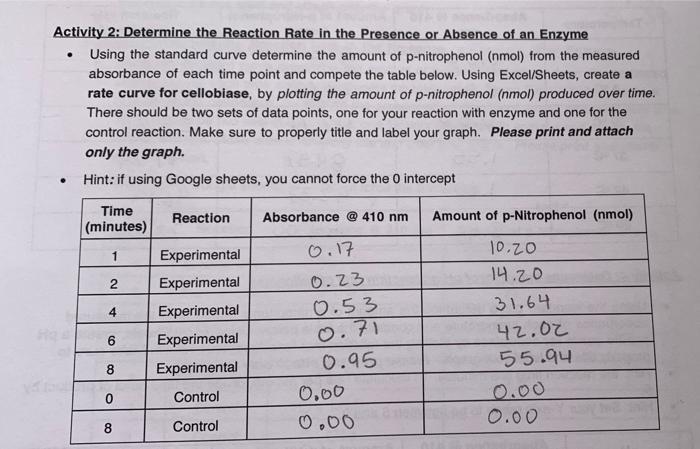
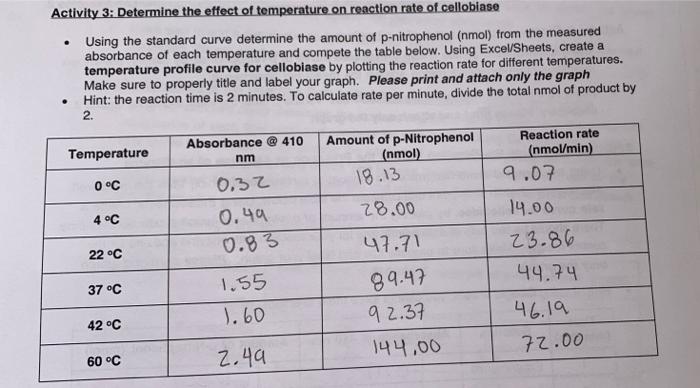
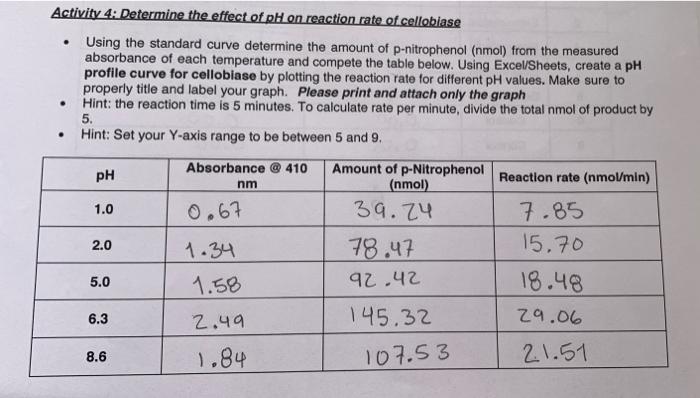
. Activity 2: Determine the Reaction Rate in the Presence or Absence of an Enzyme Using the standard curve determine the amount of p-nitrophenol (nmol) from the measured absorbance of each time point and compete the table below. Using Excel/Sheets, create a rate curve for cellobiase, by plotting the amount of p-nitrophenol (nmol) produced over time. There should be two sets of data points, one for your reaction with enzyme and one for the control reaction. Make sure to properly title and label your graph. Please print and attach only the graph Hint: if using Google sheets, you cannot force the intercept . Time (minutes) Reaction Absorbance @ 410 nm Amount of p-Nitrophenol (nmol) 1 2 4 Experimental Experimental Experimental Experimental Experimental 0.17 0.23 0.53 0.71 0.95 0,00 0.00 10.20 14.20 31.64 42.02 55.94 0.00 0.00 6 8 0 Control 8 Control Activity 3: Determine the effect of temperature on reaction rate of cellobiase Using the standard curve determine the amount of p-nitrophenol (nmol) from the measured absorbance of each temperature and compete the table below. Using Excel/Sheets, create a temperature profile curve for cellobiase by plotting the reaction rate for different temperatures. Make sure to properly title and label your graph. Please print and attach only the graph Hint: the reaction time is 2 minutes. To calculate rate per minute, divide the total nmol of product by 2. Temperature Absorbance @ 410 nm Amount of p-Nitrophenol (nmol) Reaction rate (nmol/min) 9.07. 18.13 0C 0.32 0.49 4 C 28.00 47.71 0.83 22 C 37 C 1.55 1.60 14.00 23.86 44.74 46.19 72.00 89.47 92.37 42 C 144,00 60 C 2.49 . . PH Activity 4: Determine the effect of pH on reaction rate of cellobiase Using the standard curve determine the amount of p-nitrophenol (nmol) from the measured absorbance of each temperature and compete the table below. Using Excel/Sheets, create a pH profile curve for celloblase by plotting the reaction rate for different pH values. Make sure to properly title and label your graph. Please print and attach only the graph Hint: the reaction time is 5 minutes. To calculate rate per minute, divide the total nmol of product by 5. Hint: Set your Y-axis range to be between 5 and 9. Absorbance @ 410 Amount of p-Nitrophenol Reaction rate (nmol/min) nm (nmol) 1.0 0.67 39.24 7.85 2.0 1.34 78.47 15.70 1.58 92.42 18.48 6.3 2.49 145.32 29.06 8.6 1.84 21.51 5.0 107.53
Step by Step Solution
There are 3 Steps involved in it

Get step-by-step solutions from verified subject matter experts