

Question: need help on question 2 Module 4 Excel Assignment #2 Complete the following assignment: Download the following Excel data file : Excel Assignment #2 1.
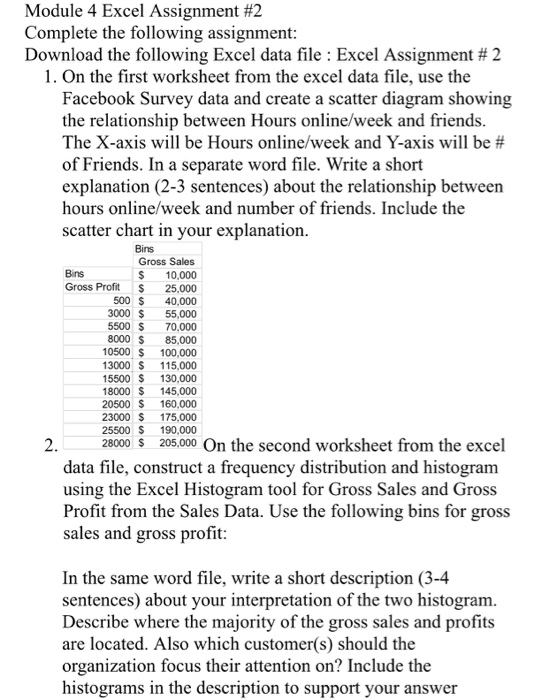
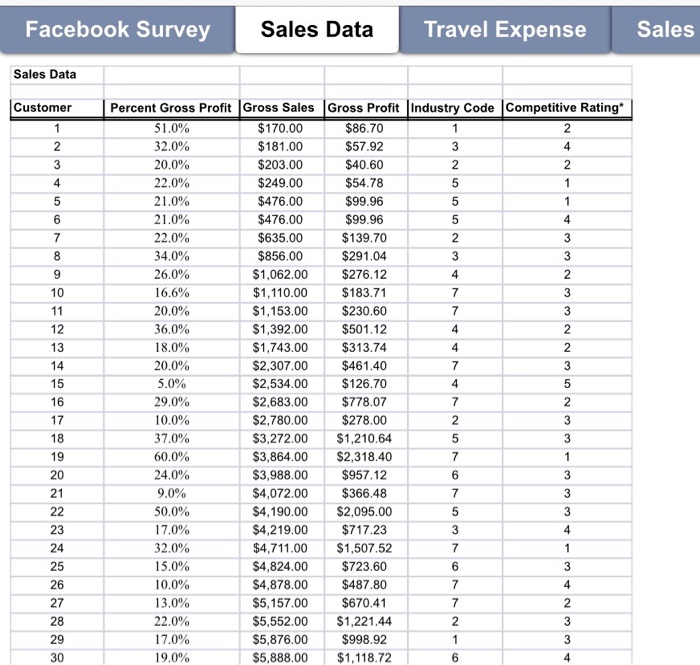
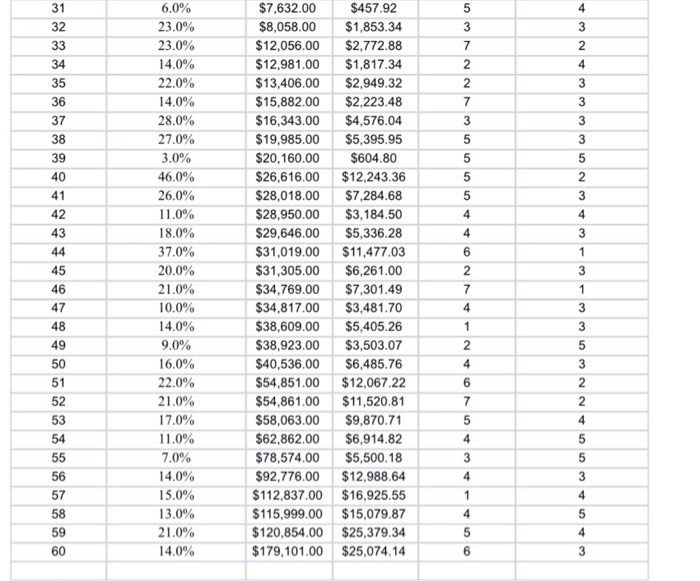
Module 4 Excel Assignment #2 Complete the following assignment: Download the following Excel data file : Excel Assignment #2 1. On the first worksheet from the excel data file, use the Facebook Survey data and create a scatter diagram showing the relationship between Hours online/week and friends. The X-axis will be Hours online/week and Y-axis will be # of Friends. In a separate word file. Write a short explanation (2-3 sentences) about the relationship between hours online/week and number of friends. Include the scatter chart in your explanation. Bins Gross Sales Bins 10,000 Gross Profit $ 25,000 500S 40,000 3000 $ 55,000 5500 $ 70,000 8000 $ 85,000 10500 $ 100,000 13000 $ 115,000 15500 $ 130,000 18000 $ 145,000 20500 $ 160,000 23000 $ 175,000 25500 $ 190,000 28000 $ 205,000 On the second worksheet from the excel data file, construct a frequency distribution and histogram using the Excel Histogram tool for Gross Sales and Gross Profit from the Sales Data. Use the following bins for gross sales and gross profit: In the same word file, write a short description (3-4 sentences) about your interpretation of the two histogram. Describe where the majority of the gross sales and profits are located. Also which customer(s) should the organization focus their attention on? Include the histograms in the description to support your answer Facebook Survey Sales Data Travel Expense Sales Sales Data Customer Percent Gross Profit Gross Sales Gross Profit Industry Code Competitive Rating 51.0% $170.00 $86.70 32.0% $181.00 $57.92 20.0% $203.00 $40.60 22.0% $249.00 $54.78 21.0% $476.00 $99.96 21.0% $476.00 $99.96 22.0% $635.00 $139.70 34.0% $856.00 $291.04 26.0% $1,062.00 $276.12 16.6% $1,110.00 $183.71 20.0% $1,153.00 $230.60 36.0% $1,392.00 $501.12 18.0% $1,743.00 $313.74 20.0% $2,307.00 $461.40 5.0% $2,534.00 $126.70 29.0% $2,683.00 $778.07 10.0% $2,780.00 $278.00 37.0% $3,272.00 $1,210.64 60.0% $3,864.00 $2,318.40 24.0% $3,988.00 $957.12 9.0% $4,072.00 $366.48 50.0% $4,190.00 $2,095.00 17.0% $4,219.00 $717.23 32.0% $4,711.00 $1,507.52 15.0% $4,824.00 $723.60 10.0% $4,878.00 $487.80 13.0% $5,157.00 $670.41 22.0% $5,552.00 $1,221,44 17.0% $5,876.00 $998.92 19.0% $5,888.00 $1,118.72 6 - NOWOONAA WNNW - 6.0% 23.0% 23.0% 14.0% 22.0% 14.0% 28.0% 27.0% 3.0% 46.0% 26.0% 11.0% 18.0% 37.0% 20.0% 21.0% 10.0% 14.0% 9.0% 16.0% 22.0% 21.0% 17.0% 11.0% 7.0% 14.0% 15.0% 13.0% 21.0% 14.0% $7,632.00 $8,058.00 $12,056.00 $12,981.00 $13,406.00 $15,882.00 $16,343.00 $19,985.00 $20,160.00 $26,616.00 $28,018.00 $28,950.00 $29,646.00 $31,019.00 $31,305.00 $34,769.00 $34,817.00 $38,609.00 $38.923.00 $40,536.00 $54,851.00 $54,861.00 $58,063.00 $62,862.00 $78,574.00 $92,776.00 $112,837.00 $115,999.00 $120,854.00 $179, 101.00 $457.92 $1,853.34 $2,772.88 $1,817.34 $2,949.32 $2,223.48 $4,576.04 $5,395.95 $604.80 $12,243.36 $7,284.68 $3,184.50 $5,336.28 $11,477.03 $6,261.00 $7,301.49 $3,481.70 $5,405.26 $3.503.07 $6,485.76 $12,067.22 $11,520.81 $9,870.71 $6,914.82 $5,500.18 $12,988.64 $16,925.55 $15,079.87 $25,379.34 $25,074.14 WowANNW WWW-WAWNow www ANWA Module 4 Excel Assignment #2 Complete the following assignment: Download the following Excel data file : Excel Assignment #2 1. On the first worksheet from the excel data file, use the Facebook Survey data and create a scatter diagram showing the relationship between Hours online/week and friends. The X-axis will be Hours online/week and Y-axis will be # of Friends. In a separate word file. Write a short explanation (2-3 sentences) about the relationship between hours online/week and number of friends. Include the scatter chart in your explanation. Bins Gross Sales Bins 10,000 Gross Profit $ 25,000 500S 40,000 3000 $ 55,000 5500 $ 70,000 8000 $ 85,000 10500 $ 100,000 13000 $ 115,000 15500 $ 130,000 18000 $ 145,000 20500 $ 160,000 23000 $ 175,000 25500 $ 190,000 28000 $ 205,000 On the second worksheet from the excel data file, construct a frequency distribution and histogram using the Excel Histogram tool for Gross Sales and Gross Profit from the Sales Data. Use the following bins for gross sales and gross profit: In the same word file, write a short description (3-4 sentences) about your interpretation of the two histogram. Describe where the majority of the gross sales and profits are located. Also which customer(s) should the organization focus their attention on? Include the histograms in the description to support your answer Facebook Survey Sales Data Travel Expense Sales Sales Data Customer Percent Gross Profit Gross Sales Gross Profit Industry Code Competitive Rating 51.0% $170.00 $86.70 32.0% $181.00 $57.92 20.0% $203.00 $40.60 22.0% $249.00 $54.78 21.0% $476.00 $99.96 21.0% $476.00 $99.96 22.0% $635.00 $139.70 34.0% $856.00 $291.04 26.0% $1,062.00 $276.12 16.6% $1,110.00 $183.71 20.0% $1,153.00 $230.60 36.0% $1,392.00 $501.12 18.0% $1,743.00 $313.74 20.0% $2,307.00 $461.40 5.0% $2,534.00 $126.70 29.0% $2,683.00 $778.07 10.0% $2,780.00 $278.00 37.0% $3,272.00 $1,210.64 60.0% $3,864.00 $2,318.40 24.0% $3,988.00 $957.12 9.0% $4,072.00 $366.48 50.0% $4,190.00 $2,095.00 17.0% $4,219.00 $717.23 32.0% $4,711.00 $1,507.52 15.0% $4,824.00 $723.60 10.0% $4,878.00 $487.80 13.0% $5,157.00 $670.41 22.0% $5,552.00 $1,221,44 17.0% $5,876.00 $998.92 19.0% $5,888.00 $1,118.72 6 - NOWOONAA WNNW - 6.0% 23.0% 23.0% 14.0% 22.0% 14.0% 28.0% 27.0% 3.0% 46.0% 26.0% 11.0% 18.0% 37.0% 20.0% 21.0% 10.0% 14.0% 9.0% 16.0% 22.0% 21.0% 17.0% 11.0% 7.0% 14.0% 15.0% 13.0% 21.0% 14.0% $7,632.00 $8,058.00 $12,056.00 $12,981.00 $13,406.00 $15,882.00 $16,343.00 $19,985.00 $20,160.00 $26,616.00 $28,018.00 $28,950.00 $29,646.00 $31,019.00 $31,305.00 $34,769.00 $34,817.00 $38,609.00 $38.923.00 $40,536.00 $54,851.00 $54,861.00 $58,063.00 $62,862.00 $78,574.00 $92,776.00 $112,837.00 $115,999.00 $120,854.00 $179, 101.00 $457.92 $1,853.34 $2,772.88 $1,817.34 $2,949.32 $2,223.48 $4,576.04 $5,395.95 $604.80 $12,243.36 $7,284.68 $3,184.50 $5,336.28 $11,477.03 $6,261.00 $7,301.49 $3,481.70 $5,405.26 $3.503.07 $6,485.76 $12,067.22 $11,520.81 $9,870.71 $6,914.82 $5,500.18 $12,988.64 $16,925.55 $15,079.87 $25,379.34 $25,074.14 WowANNW WWW-WAWNow www ANWA
Step by Step Solution
There are 3 Steps involved in it

Get step-by-step solutions from verified subject matter experts