

Question: Need help on question on B,F,G and H. Graphing and Describing a Volume Function A rectangular piece of cardboard of size 16 inches by 20

Need help on question on B,F,G and H.
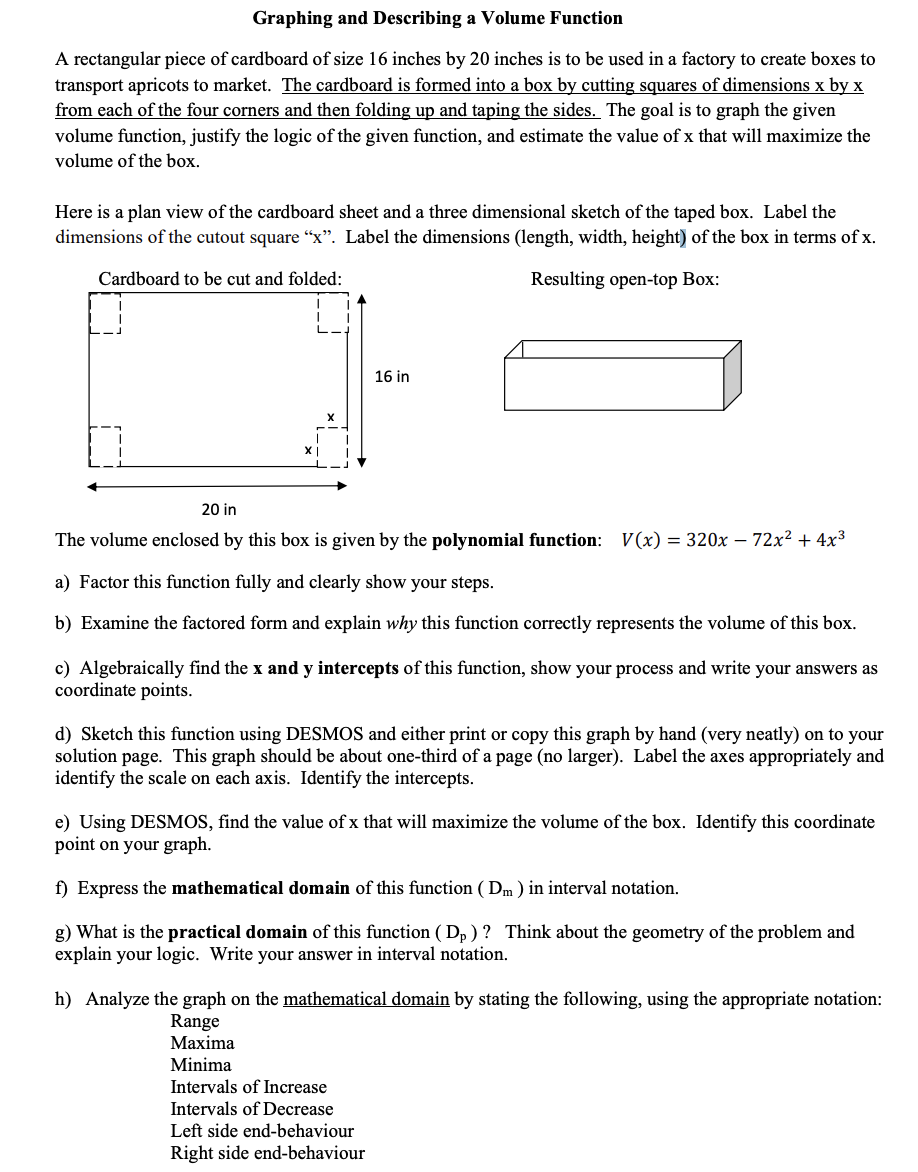
Graphing and Describing a Volume Function A rectangular piece of cardboard of size 16 inches by 20 inches is to be used in a factory to create boxes to transport apricots to market. The cardboard is formed into a box by cutting mares of dimensions x by x from each of the four corners and then folding up and taping the sides. The goal is to graph the given volume mction, justify the logic of the given function, and estimate the value of x that will maximize the volume of the box. Here is a plan view of the cardboard sheet and a three dimensional sketch of the taped box. Label the dimensions of the cutout square \"x\". Label the dimensions (length, width, heightI of the box in terms of x. Cardboard to be cut and folded: Resulting open-top Box: 16 in 20 in The volume enclosed by this box is given by the polynomial function: V(x) = 320:: '72]:2 -|- 4x3 a) Factor this function fully and clearly show your steps. b) Examine the factored form and explain why this mction correctly represents the volume of this box. c) Algebraically find the x and y intercepts of this function, show your process and write your answers as coordinate points. d) Sketch this mction using DESMOS and either print or copy this graph by hand (very neatly) on to your solution page. This graph should be about one-third of a page (no larger). Label the axes appropriately and identify the scale on each axis. Identify the intercepts. e) Using DESMOS, nd the value of x that will maximize the volume of the box. Identify this coordinate point on your graph. f) Express the mathematical domain of this flmction ( DI11 ) in interval notation. g) What is the practical domain of this function ( DP) ? Think about the geometry of the problem and explain your logic. Write your answer in interval notation. h) Analyze the graph on the mathematical domain by stating the following, using the appropriate notation: Intervals of Increase Intervals of Decrease Left side end-behaviour Right side end-behaviour
Step by Step Solution
There are 3 Steps involved in it

Get step-by-step solutions from verified subject matter experts