

Question: Need help on the financial statements, I provided the Transaction Analysis. Thank You! begin{tabular}{|c|c|c|c|c|c|c|c|c|c|c|} hline & multicolumn{8}{|c|}{ Balance Sheet } & multicolumn{2}{|c|}{ Income Statement }
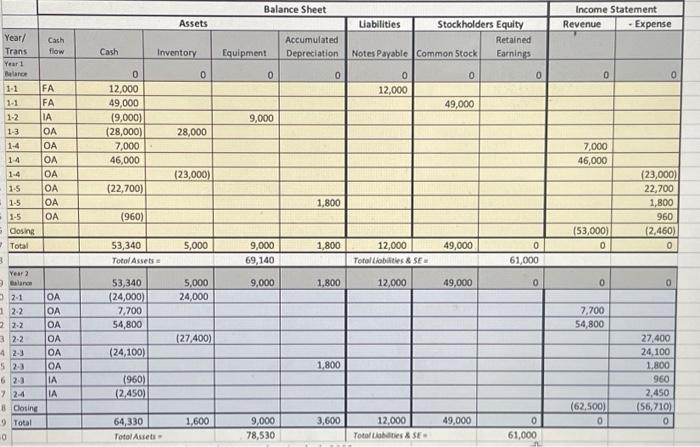
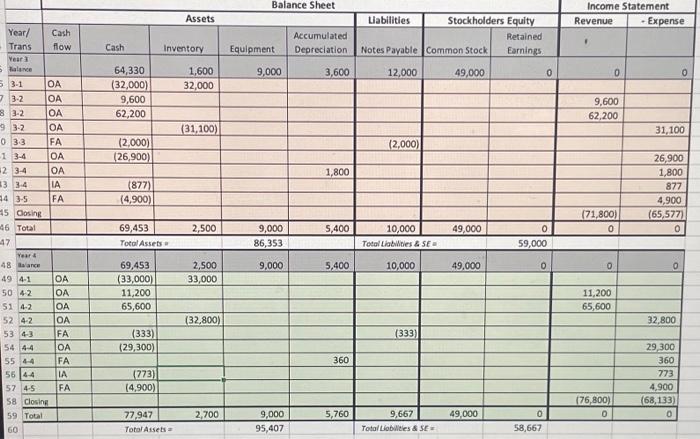
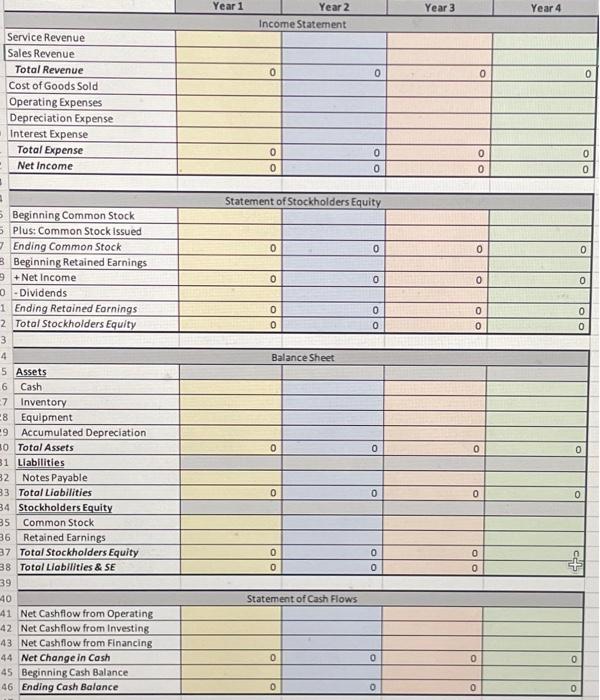
\begin{tabular}{|c|c|c|c|c|c|c|c|c|c|c|} \hline & \multicolumn{8}{|c|}{ Balance Sheet } & \multicolumn{2}{|c|}{ Income Statement } \\ \hline & \multicolumn{5}{|c|}{ Assets } & \multirow{2}{*}{\begin{tabular}{|c|} Liabilities \\ Notes Parable \\ \end{tabular}} & \multicolumn{2}{|c|}{ Stockholders Equity } & \multirow{2}{*}{ Revenue } & \multirow[t]{2}{*}{ - Expense } \\ \hline Year/Trans & Cashflow & Cash & Inventory & Equipment & AccumulatedDepreciation & & Common Stock & RetainedEarnings & & \\ \hline Year1gabrot & & 0 & 0 & 0 & 0 & 0 & 0 & 0 & 0 & 0 \\ \hline 1-1 & FA & 12,000 & & & & 12,000 & & & & \\ \hline 11 & FA & 49,000 & & & & & 49,000 & & & \\ \hline 1.2 & IA & (9,000) & & 9,000 & & & & & & \\ \hline 1-3 & OA & (28,000) & 28,000 & & & & & & & \\ \hline 14 & OA & 7,000 & & & & & & & 7,000 & \\ \hline 14 & OA & 46,000 & & & & & & & 46,000 & \\ \hline 1.4 & OA & & (23,000) & & & & & & & (23,000) \\ \hline 1.5 & OA & (22,700) & & & & & & & & 22,700 \\ \hline 1.5 & OA & & & & 1,800 & & & & & 1,800 \\ \hline 1.5 & OA & (960) & & T & & & & & & 960 \\ \hline Oosing. & & & & & & & & & (53,000) & (2,460) \\ \hline \multirow[t]{2}{*}{ Total } & & \begin{tabular}{|l|l|} 53,340 & \\ \end{tabular} & 5,000 & 9,000 & 1,800 & 12,000 & 49,000 & 0 & 0 & 0 \\ \hline & & \multicolumn{2}{|c|}{ Totol Assess = } & 69,140 & & \multicolumn{2}{|c|}{ Total Liobilites \& SE = } & 61,000 & & \\ \hline Yeer?Eisno & & 53,340 & 5,000 & 9,000 & 1,800 & 12,000 & 49,000 & 0 & 0 & 0 \\ \hline 21 & OA & (24,000) & 24,000 & & & & & & & \\ \hline 22 & OA & 7,700 & & & & & 2 & & 7,700 & \\ \hline 2.2 & OA & 54,800 & & & & & & & 54,800 & \\ \hline 2.2 & OA & & (27,400) & & & & & & & 27,400 \\ \hline 2.3 & OA & (24,100) & & & & & & & & 24,100 \\ \hline 2.3 & OA & & & & 1.800 & & & & & 1.800 \\ \hline 2.3 & IA & (960) & & & & & & & & 960 \\ \hline 24 & IA & (2,450) & & & & & & & & 2,450 \\ \hline Oosine & & & & & & & & & (62.500) & (56,710) \\ \hline Total & & 64,330 & 1.600 & 9,000 & 3,600 & 12,000 & \begin{tabular}{|l|l|} 49,000 & \\ \end{tabular} & 0 & 0 & 0 \\ \hline & & FotolAsse & & 78,530 & & Totol Livbloties \& & 56 : & 61,000 & & \\ \hline \end{tabular} \begin{tabular}{|c|c|c|c|c|c|c|c|c|c|c|c|} \hline & \multirow{3}{*}{Year/Trans} & \multicolumn{8}{|c|}{ Balance Sheet } & \multicolumn{2}{|c|}{ Income Statement } \\ \hline & & \multicolumn{5}{|c|}{ Assets } & \multirow{2}{*}{\begin{tabular}{|l|} Labilities \\ Notes Payable \\ \end{tabular}} & \multicolumn{2}{|c|}{ Stockhoiders Equity } & \multirow{2}{*}{ Revenue } & \multirow[t]{2}{*}{-Expense } \\ \hline & & Cashflow & Cash & Inventory & Equipment & AccumulatedDepreciation & & Common Stock & RetainedEarnings & & \\ \hline & Year3Ralance & & 64,330 & 1,600 & 9,000 & 3,600 & 12,000 & 49,000 & 0 & 0 & 0 \\ \hline & 3-1 & OA & (32,000) & 32,000 & & & & & & & \\ \hline & 32 & OA & 9,600 & & & & & & & 9,600 & \\ \hline & 32 & OA & 62,200 & & & & & & & 62,200 & \\ \hline 9 & 3.2 & OA & & (31,100) & & & & + & & & 31,100 \\ \hline 0 & 3.3 & FA & (2,000) & & & & (2,000) & & & & \\ \hline 1. & 34 & OA & (26,900) & & & & & & & & 26,900 \\ \hline 2 & 3-4 & OA & & & & 1,800 & & & & & 1,800 \\ \hline 3 & 34 & LA & (877) & & & & & & & & 877 \\ \hline 14 & 3.5 & FA & (4,900) & & & & & + & & & 4,900 \\ \hline 45 & Oosing & & & & & & & & & (71,800) & (65,577) \\ \hline 46 & Total & & \begin{tabular}{|l|l|} 69,453 \\ \end{tabular} & 2,500 & 9,000 & 5,400 & 10,000 & 49,000 & 0 & 0 & 0 \\ \hline 47 & & & Totol Asse: & & 86,353 & & Total Labilibies 4 & 5E= & 59,000 & & \\ \hline 48 & & & 69,453 & 2,500 & 9,000 & 5,400 & 10,000 & 49,000 & 0 & 0 & 0 \\ \hline 49 & 41 & OA & (33,000) & 33,000 & & & & & & & \\ \hline 50 & 42 & OA & 11,200 & & & & & & & 11,200 & \\ \hline 51 & 42 & OA & 65,600 & & & & & & & 65,600 & \\ \hline 52 & 42 & OA & & (32,800) & & & & & & & 32,800 \\ \hline 53 & 43 & FA & (333) & & & & (333) & & & & \\ \hline 54 & 44 & OA & (29,300) & & & & & & & & 29,300 \\ \hline 55 & 44 & FA & & & & 360 & & & & & 360 \\ \hline 56 & 44 & IA & (773) & & & & & & & & 773 \\ \hline 57 & 4.5 & FA & (4,900) & & & & & & & & 4,900 \\ \hline 58 & Closing & & & & & & & & & (76,800) & (68,133) \\ \hline 59 & Toul & & 77,947 & 2,700 & 9,000 & 5,760 & 9,667 & 49,000 & 0 & 0 & 0 \\ \hline 60 & & & TotorAsse & & 95,407 & & Total Liabilites \& 5 & & 58,667 & & \\ \hline \end{tabular} \begin{tabular}{|c|c|c|c|c|} \hline \multicolumn{5}{|c|}{ Balance Sheet } \\ \hline Assets & & & & \\ \hline Cash & & & & \\ \hline Inventory & & & & \\ \hline Equipment & & & & \\ \hline Accumulated Depreciation & & & & \\ \hline Total Assets & 0 & 0 & 0 & 0 \\ \hline Llabilities & & & & \\ \hline Notes Payable & & & & \\ \hline Total Liabilities & 0 & 0 & 0 & 0 \\ \hline Stockholders Equity & & & & \\ \hline Common Stock & & & & \\ \hline Retained Earnings & & & & \\ \hline Total Stockholders Equity & 0 & 0 & 0 & 0 \\ \hline Totol Liabilities \& SE & 0 & 0 & 0 & \\ \hline \end{tabular} \begin{tabular}{|l|r|r|r|r|} \hline \multicolumn{3}{|c|}{ Statement of Cash Flows } & & \\ \hline Net Cashflow from Operating & & & & \\ \hline Net Cashflow from Investing & & & & \\ \hline Net Cashflow from Financing & & & & \\ \hline Net Change in Cosh & 0 & 0 & 0 & \\ \hline Beginning Cash Balance & & & & \\ \hline Ending Cash Balance & 0 & 0 & 0 & 0 \\ \hline \end{tabular} \begin{tabular}{|c|c|c|c|c|c|c|c|c|c|c|} \hline & \multicolumn{8}{|c|}{ Balance Sheet } & \multicolumn{2}{|c|}{ Income Statement } \\ \hline & \multicolumn{5}{|c|}{ Assets } & \multirow{2}{*}{\begin{tabular}{|c|} Liabilities \\ Notes Parable \\ \end{tabular}} & \multicolumn{2}{|c|}{ Stockholders Equity } & \multirow{2}{*}{ Revenue } & \multirow[t]{2}{*}{ - Expense } \\ \hline Year/Trans & Cashflow & Cash & Inventory & Equipment & AccumulatedDepreciation & & Common Stock & RetainedEarnings & & \\ \hline Year1gabrot & & 0 & 0 & 0 & 0 & 0 & 0 & 0 & 0 & 0 \\ \hline 1-1 & FA & 12,000 & & & & 12,000 & & & & \\ \hline 11 & FA & 49,000 & & & & & 49,000 & & & \\ \hline 1.2 & IA & (9,000) & & 9,000 & & & & & & \\ \hline 1-3 & OA & (28,000) & 28,000 & & & & & & & \\ \hline 14 & OA & 7,000 & & & & & & & 7,000 & \\ \hline 14 & OA & 46,000 & & & & & & & 46,000 & \\ \hline 1.4 & OA & & (23,000) & & & & & & & (23,000) \\ \hline 1.5 & OA & (22,700) & & & & & & & & 22,700 \\ \hline 1.5 & OA & & & & 1,800 & & & & & 1,800 \\ \hline 1.5 & OA & (960) & & T & & & & & & 960 \\ \hline Oosing. & & & & & & & & & (53,000) & (2,460) \\ \hline \multirow[t]{2}{*}{ Total } & & \begin{tabular}{|l|l|} 53,340 & \\ \end{tabular} & 5,000 & 9,000 & 1,800 & 12,000 & 49,000 & 0 & 0 & 0 \\ \hline & & \multicolumn{2}{|c|}{ Totol Assess = } & 69,140 & & \multicolumn{2}{|c|}{ Total Liobilites \& SE = } & 61,000 & & \\ \hline Yeer?Eisno & & 53,340 & 5,000 & 9,000 & 1,800 & 12,000 & 49,000 & 0 & 0 & 0 \\ \hline 21 & OA & (24,000) & 24,000 & & & & & & & \\ \hline 22 & OA & 7,700 & & & & & 2 & & 7,700 & \\ \hline 2.2 & OA & 54,800 & & & & & & & 54,800 & \\ \hline 2.2 & OA & & (27,400) & & & & & & & 27,400 \\ \hline 2.3 & OA & (24,100) & & & & & & & & 24,100 \\ \hline 2.3 & OA & & & & 1.800 & & & & & 1.800 \\ \hline 2.3 & IA & (960) & & & & & & & & 960 \\ \hline 24 & IA & (2,450) & & & & & & & & 2,450 \\ \hline Oosine & & & & & & & & & (62.500) & (56,710) \\ \hline Total & & 64,330 & 1.600 & 9,000 & 3,600 & 12,000 & \begin{tabular}{|l|l|} 49,000 & \\ \end{tabular} & 0 & 0 & 0 \\ \hline & & FotolAsse & & 78,530 & & Totol Livbloties \& & 56 : & 61,000 & & \\ \hline \end{tabular} \begin{tabular}{|c|c|c|c|c|c|c|c|c|c|c|c|} \hline & \multirow{3}{*}{Year/Trans} & \multicolumn{8}{|c|}{ Balance Sheet } & \multicolumn{2}{|c|}{ Income Statement } \\ \hline & & \multicolumn{5}{|c|}{ Assets } & \multirow{2}{*}{\begin{tabular}{|l|} Labilities \\ Notes Payable \\ \end{tabular}} & \multicolumn{2}{|c|}{ Stockhoiders Equity } & \multirow{2}{*}{ Revenue } & \multirow[t]{2}{*}{-Expense } \\ \hline & & Cashflow & Cash & Inventory & Equipment & AccumulatedDepreciation & & Common Stock & RetainedEarnings & & \\ \hline & Year3Ralance & & 64,330 & 1,600 & 9,000 & 3,600 & 12,000 & 49,000 & 0 & 0 & 0 \\ \hline & 3-1 & OA & (32,000) & 32,000 & & & & & & & \\ \hline & 32 & OA & 9,600 & & & & & & & 9,600 & \\ \hline & 32 & OA & 62,200 & & & & & & & 62,200 & \\ \hline 9 & 3.2 & OA & & (31,100) & & & & + & & & 31,100 \\ \hline 0 & 3.3 & FA & (2,000) & & & & (2,000) & & & & \\ \hline 1. & 34 & OA & (26,900) & & & & & & & & 26,900 \\ \hline 2 & 3-4 & OA & & & & 1,800 & & & & & 1,800 \\ \hline 3 & 34 & LA & (877) & & & & & & & & 877 \\ \hline 14 & 3.5 & FA & (4,900) & & & & & + & & & 4,900 \\ \hline 45 & Oosing & & & & & & & & & (71,800) & (65,577) \\ \hline 46 & Total & & \begin{tabular}{|l|l|} 69,453 \\ \end{tabular} & 2,500 & 9,000 & 5,400 & 10,000 & 49,000 & 0 & 0 & 0 \\ \hline 47 & & & Totol Asse: & & 86,353 & & Total Labilibies 4 & 5E= & 59,000 & & \\ \hline 48 & & & 69,453 & 2,500 & 9,000 & 5,400 & 10,000 & 49,000 & 0 & 0 & 0 \\ \hline 49 & 41 & OA & (33,000) & 33,000 & & & & & & & \\ \hline 50 & 42 & OA & 11,200 & & & & & & & 11,200 & \\ \hline 51 & 42 & OA & 65,600 & & & & & & & 65,600 & \\ \hline 52 & 42 & OA & & (32,800) & & & & & & & 32,800 \\ \hline 53 & 43 & FA & (333) & & & & (333) & & & & \\ \hline 54 & 44 & OA & (29,300) & & & & & & & & 29,300 \\ \hline 55 & 44 & FA & & & & 360 & & & & & 360 \\ \hline 56 & 44 & IA & (773) & & & & & & & & 773 \\ \hline 57 & 4.5 & FA & (4,900) & & & & & & & & 4,900 \\ \hline 58 & Closing & & & & & & & & & (76,800) & (68,133) \\ \hline 59 & Toul & & 77,947 & 2,700 & 9,000 & 5,760 & 9,667 & 49,000 & 0 & 0 & 0 \\ \hline 60 & & & TotorAsse & & 95,407 & & Total Liabilites \& 5 & & 58,667 & & \\ \hline \end{tabular} \begin{tabular}{|c|c|c|c|c|} \hline \multicolumn{5}{|c|}{ Balance Sheet } \\ \hline Assets & & & & \\ \hline Cash & & & & \\ \hline Inventory & & & & \\ \hline Equipment & & & & \\ \hline Accumulated Depreciation & & & & \\ \hline Total Assets & 0 & 0 & 0 & 0 \\ \hline Llabilities & & & & \\ \hline Notes Payable & & & & \\ \hline Total Liabilities & 0 & 0 & 0 & 0 \\ \hline Stockholders Equity & & & & \\ \hline Common Stock & & & & \\ \hline Retained Earnings & & & & \\ \hline Total Stockholders Equity & 0 & 0 & 0 & 0 \\ \hline Totol Liabilities \& SE & 0 & 0 & 0 & \\ \hline \end{tabular} \begin{tabular}{|l|r|r|r|r|} \hline \multicolumn{3}{|c|}{ Statement of Cash Flows } & & \\ \hline Net Cashflow from Operating & & & & \\ \hline Net Cashflow from Investing & & & & \\ \hline Net Cashflow from Financing & & & & \\ \hline Net Change in Cosh & 0 & 0 & 0 & \\ \hline Beginning Cash Balance & & & & \\ \hline Ending Cash Balance & 0 & 0 & 0 & 0 \\ \hline \end{tabular}
Step by Step Solution
There are 3 Steps involved in it

Get step-by-step solutions from verified subject matter experts