

Question: need help on the two i got wrong Boxplot: Annual Mileage 8.1 11.5 16.6 6.6 23.2 5 10 15 20 25 Thousands of Miles Driven
need help on the two i got wrong
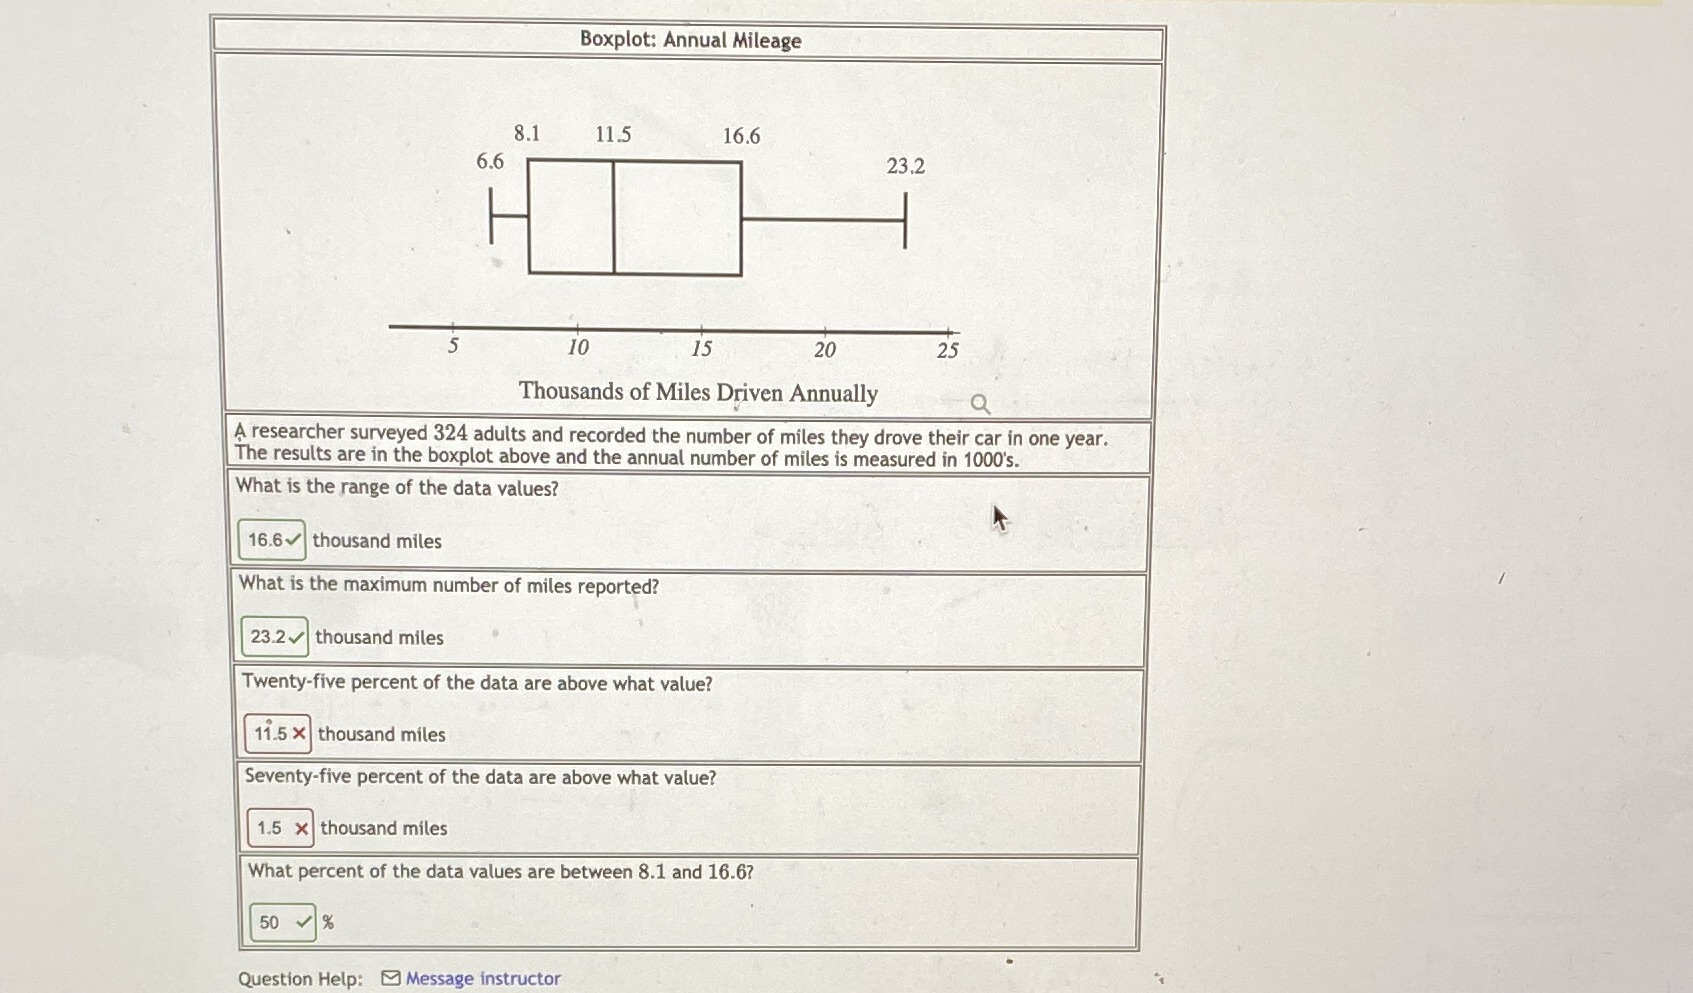
Boxplot: Annual Mileage 8.1 11.5 16.6 6.6 23.2 5 10 15 20 25 Thousands of Miles Driven Annually A researcher surveyed 324 adults and recorded the number of miles they drove their car in one year. The results are in the boxplot above and the annual number of miles is measured in 1000's. What is the range of the data values? 16.6 thousand miles What is the maximum number of miles reported? 23.2 thousand miles Twenty-five percent of the data are above what value? 11.5 x thousand miles Seventy-five percent of the data are above what value? 1.5 x thousand miles What percent of the data values are between 8.1 and 16.67 50 Question Help: Message instructor
Step by Step Solution
There are 3 Steps involved in it

Get step-by-step solutions from verified subject matter experts