

Question: need help on this question Question 3 25 pts Summary statistics for Height: Group by: Sex Sexe n Means Std dev.s# Medians IQR & Mode
need help on this question
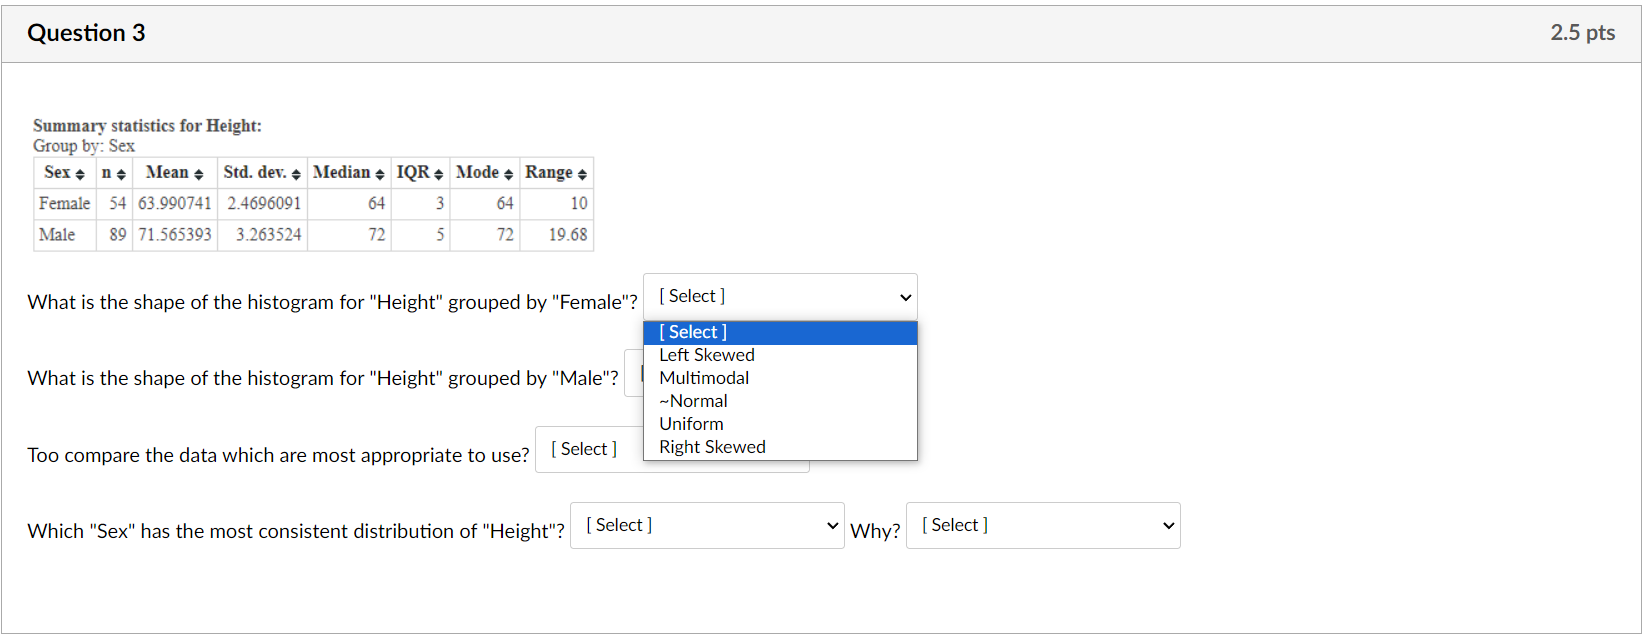
Question 3 25 pts Summary statistics for Height: Group by: Sex Sexe n Means Std dev.s# Medians IQR & Mode &+ Range s Female 354 63.990741 24696091 64 3 64 10 Male 80 71565393 3.263524 b7 5 72 19.68 What is the shape of the histogram for "Height" grouped by "Female"? What is the shape of the histogram for "Height" grouped by "Male"? Too compare the data which are most appropriate to use? [ Select] Which "Sex" has the most consistent distribution of "Height"? | Select] [ Select ] ~ [ Select ] Left Skewed Multimodal ~Normal Uniform Right Skewed Why? [ Select ]
Step by Step Solution
There are 3 Steps involved in it
1 Expert Approved Answer
Step: 1 Unlock

Question Has Been Solved by an Expert!
Get step-by-step solutions from verified subject matter experts
Step: 2 Unlock
Step: 3 Unlock