

Question: Need Help Please Consider the normal curve in the gure to the right, a which illustrates the relative frequencies in a distribution of systolic blood
Need Help Please
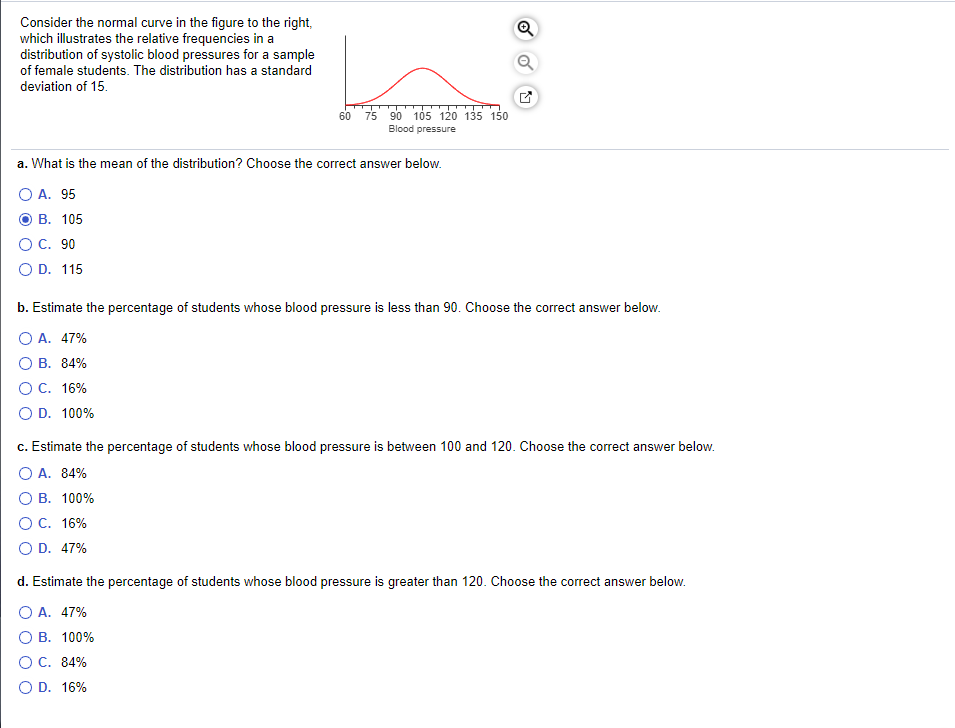
Consider the normal curve in the gure to the right, a which illustrates the relative frequencies in a distribution of systolic blood pressures for a sample Q of female students. The distribution has a standard deviation 0115. El 50- 75 90- 105120135150 Blood pressure a. What is the mean of the distribution? Choose the correct answer below. OA. 95 6,) B. 105 O C. 90 O D. 115 b. Estimate the percentage of students whose blood pressure is less than 90. Choose the correct answer below. 0 A. 47% O B. 84% O C. 15% C) D. 100% c. Estimate the percentage of students whose blood pressure is between 100 and 120. Choose the correct answer below. 0 A. 84% O B. 100% O C. 15% O D. 4?% d. Estimate the percentage of students whose blood pressure is greater than 120. Choose the correct answer below. 0 A. 4?% O B. 100% C) C. 84% O D. 15%
Step by Step Solution
There are 3 Steps involved in it

Get step-by-step solutions from verified subject matter experts