

Question: Need help please The scatterplot' below shows the relationship between a sample of 108 college students' GPAs and number of times they visited office hours
Need help please
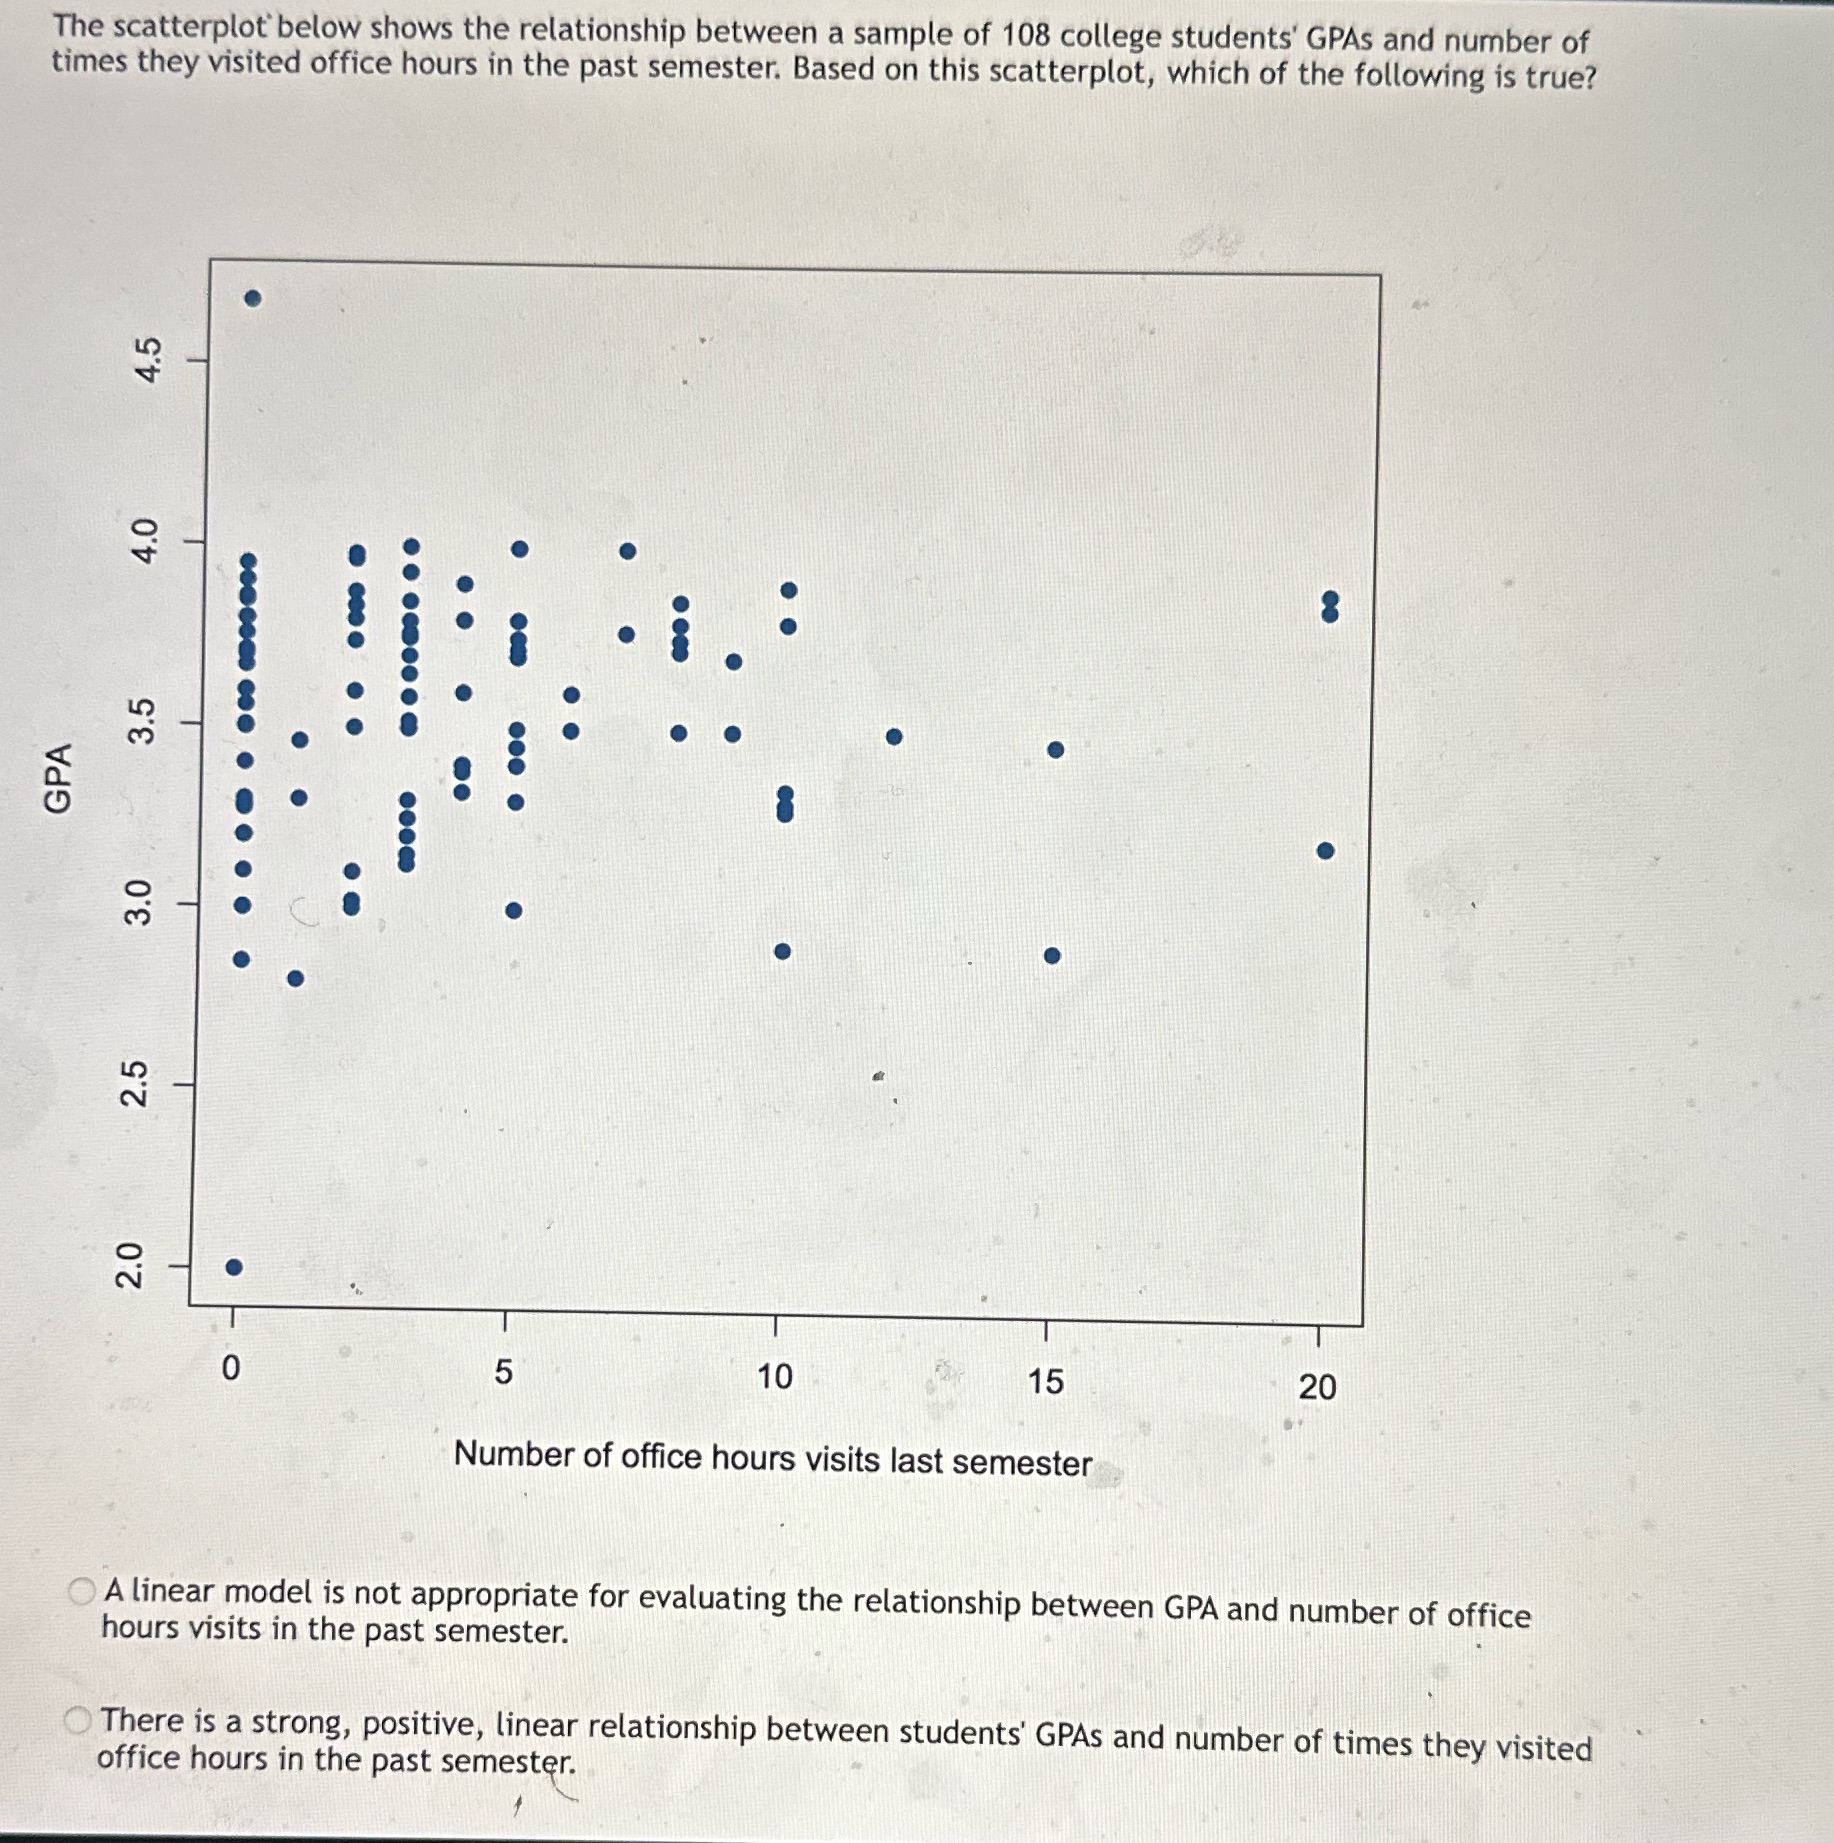
The scatterplot' below shows the relationship between a sample of 108 college students' GPAs and number of times they visited office hours in the past semester. Based on this scatterplot, which of the following is true? GPA o 0 5 10 15 20 Number of ofce hours visits last semester A linear model is not appropriate for evaluating the relationship between GPA and number of office hours visits in the past semester. - There is a strong, positive, linear relationship between students' GPAs and number of times they visited office hours in the past semester. 7 \\
Step by Step Solution
There are 3 Steps involved in it
1 Expert Approved Answer
Step: 1 Unlock

Question Has Been Solved by an Expert!
Get step-by-step solutions from verified subject matter experts
Step: 2 Unlock
Step: 3 Unlock