

Question: Need help. Pls answer. Thanks. Activity #1: I need complete and detailed solution for Range, K and C and histogram | Use available software resources
Need help. Pls answer. Thanks.
Activity #1:
I need complete and detailed solution for Range, K and C and histogram
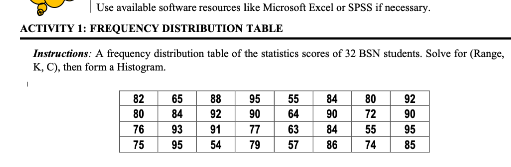
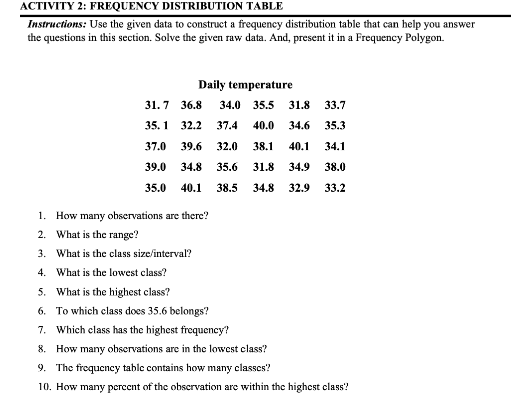
| Use available software resources like Microsoft Excel or SPSS if necessary. ACTIVITY 1: FREQUENCY DISTRIBUTION TABLE Instructions: A frequency distribution table of the statistics scores of 32 BSN students. Solve for (Range, K, C). then form a Histogram. 82 65 88 95 55 84 80 92 80 84 92 90 64 90 72 90 76 93 91 77 63 84 55 95 75 95 54 79 57 86 74 85ACTIVITY 2: FREQUENCY DISTRIBUTION TABLE Instructions: Use the given data to construct a frequency distribution table that can help you answer the questions in this section. Solve the given raw data. And, present it in a Frequency Polygon. Daily temperature 31.7 36.8 34.0 35.5 31.8 33.7 35.1 32.2 37.4 40.0 34.6 35.3 37.0 39.6 32.0 38.1 40.1 34.1 39.0 34.8 35.6 31.8 34.9 38.0 35.0 40.1 38.5 34.8 32.9 33.2 1. How many observations are there? 2. What is the range? 3. What is the class size interval? 4. What is the lowest class? 5. What is the highest class? 6. To which class does 35.6 belongs? 7. Which class has the highest frequency? 8. How many observations are in the lowest class? 9. The frequency table contains how many classes? 10. How many percent of the observation are within the highest class
Step by Step Solution
There are 3 Steps involved in it

Get step-by-step solutions from verified subject matter experts