

Question: Need help solving 3-7: Financial Data from Problem 3-6 (below) : Using the financial data in the Williams Company Chapter 3: Financial Statement Analysis 65
Need help solving 3-7:
Financial Data from Problem 3-6 (below):
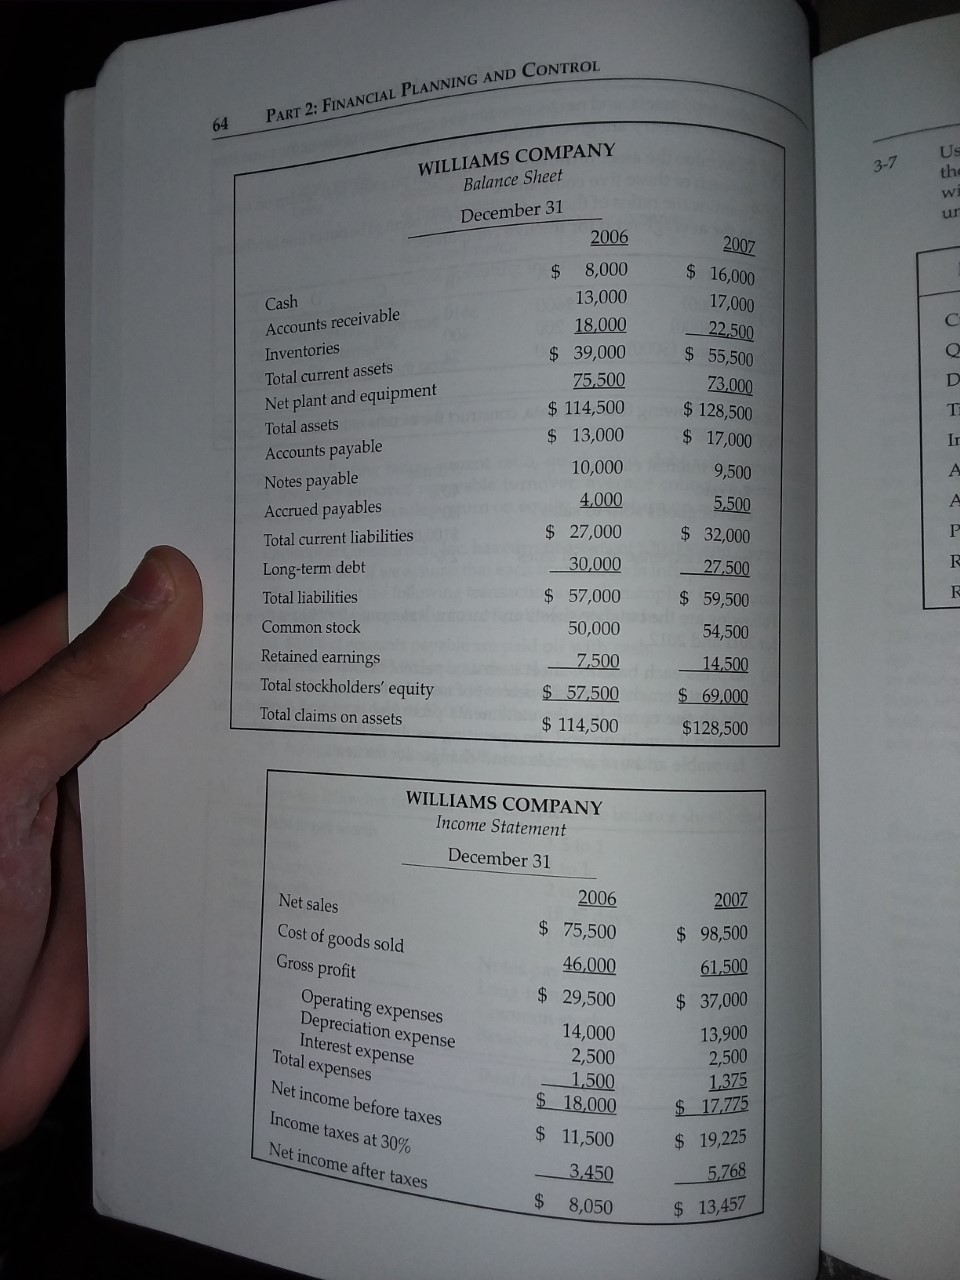
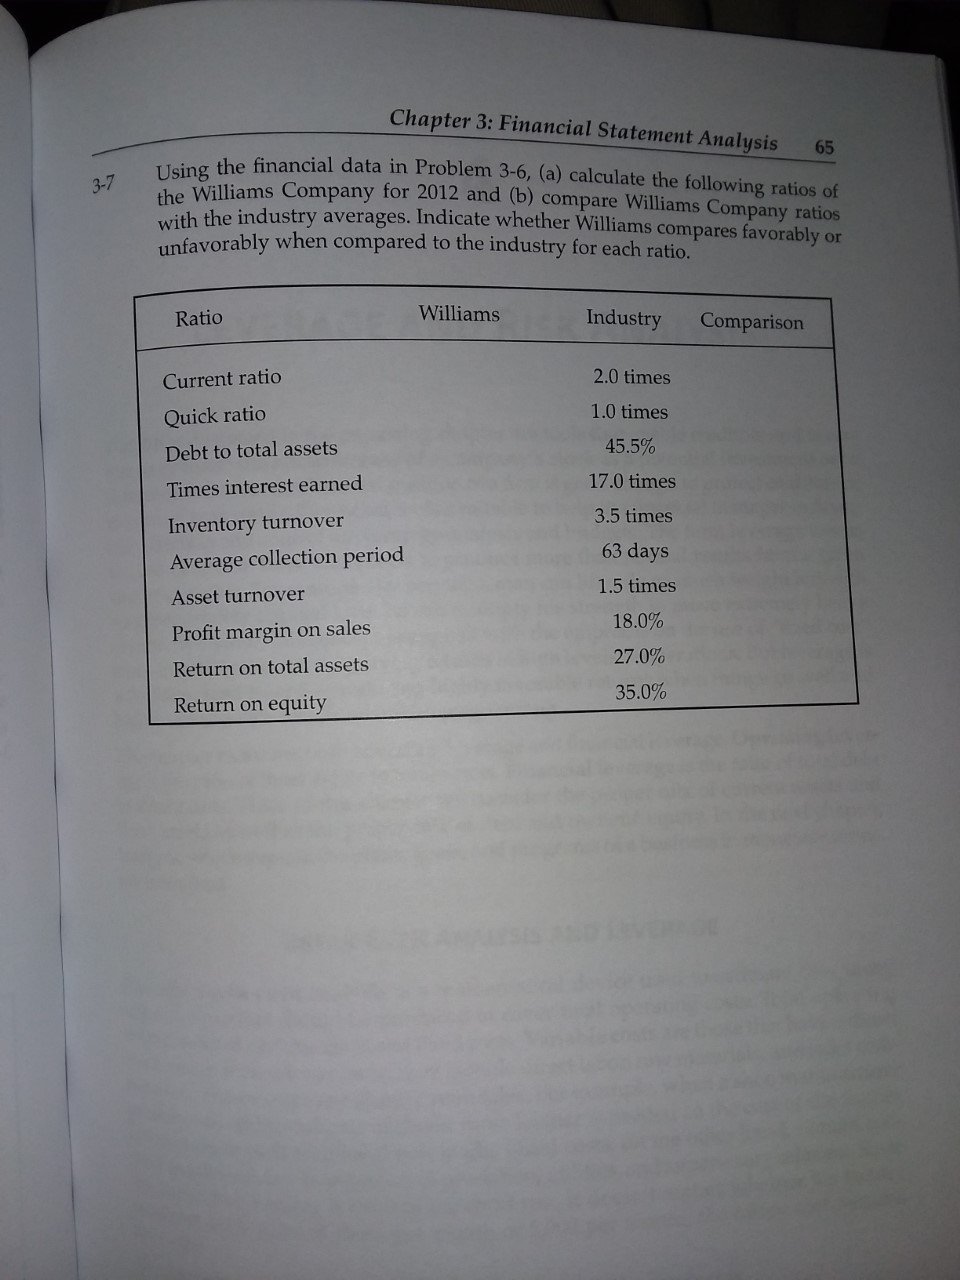
Using the financial data in the Williams Company Chapter 3: Financial Statement Analysis 65 be financial data in Problem 3-6, (a) calculate the following ratios of lliams Company for 2012 and (b) compare Williams Company ratios with the industry averages. Indicate whether Williams com unfavorably when compared to the industry for each ratio Ratio Williams Industry Comparison Current ratio Quick ratio Debt to total assets Times interest earned Inventory turnover Average collection period Asset turnover Profit margin on sales Return on total assets Return on equity 2.0 times 1.0 times 45.5% 17.0 times 3.5 times 63 days 1.5 times 18.0% 27.0% 35.0% PART 2: FINANCIAL PLANNING AND CONTROL 64 Us 3-7 WILLIAMS COMPANY Balance Sheet December 31 th wi Cash 2007 $ 16,000 17,000 22,500 $ 55,500 Accounts receivable Inventories Total current assets Net plant and equipment Total assets Accounts payable Notes payable Accrued payables Total current liabilities Long-term debt 2006 $ 8,000 13,000 18.000 $ 39,000 75,500 $ 114,500 $ 13,000 10,000 4,000 $ 27,000 30,000 $ 57,000 50,000 7,500 $ 57,500 $ 114,500 73,000 $ 128,500 $ 17,000 9,500 5,500 $ 32,000 27,500 $ 59,500 54,500 14,500 $ 69,000 $ 128,500 Total liabilities Common stock Retained earnings Total stockholders' equity Total claims on assets WILLIAMS COMPANY Income Statement December 31 Net sales Cost of goods sold Gross profit 2006 $ 75,500 46,000 $ 29,500 14,000 2,500 1,500 $ 18,000 $ 11,500 3.450 2007 $ 98,500 61,500 $ 37,000 13,900 2,500 Operating expenses Depreciation expense Interest expense Total expenses Net income before taxes Income taxes at 30% Net income after taxes 1.375 $ 17.775 $ 19,225 5.768 $ 13,457 $ 8,050 Using the financial data in the Williams Company Chapter 3: Financial Statement Analysis 65 be financial data in Problem 3-6, (a) calculate the following ratios of lliams Company for 2012 and (b) compare Williams Company ratios with the industry averages. Indicate whether Williams com unfavorably when compared to the industry for each ratio Ratio Williams Industry Comparison Current ratio Quick ratio Debt to total assets Times interest earned Inventory turnover Average collection period Asset turnover Profit margin on sales Return on total assets Return on equity 2.0 times 1.0 times 45.5% 17.0 times 3.5 times 63 days 1.5 times 18.0% 27.0% 35.0% PART 2: FINANCIAL PLANNING AND CONTROL 64 Us 3-7 WILLIAMS COMPANY Balance Sheet December 31 th wi Cash 2007 $ 16,000 17,000 22,500 $ 55,500 Accounts receivable Inventories Total current assets Net plant and equipment Total assets Accounts payable Notes payable Accrued payables Total current liabilities Long-term debt 2006 $ 8,000 13,000 18.000 $ 39,000 75,500 $ 114,500 $ 13,000 10,000 4,000 $ 27,000 30,000 $ 57,000 50,000 7,500 $ 57,500 $ 114,500 73,000 $ 128,500 $ 17,000 9,500 5,500 $ 32,000 27,500 $ 59,500 54,500 14,500 $ 69,000 $ 128,500 Total liabilities Common stock Retained earnings Total stockholders' equity Total claims on assets WILLIAMS COMPANY Income Statement December 31 Net sales Cost of goods sold Gross profit 2006 $ 75,500 46,000 $ 29,500 14,000 2,500 1,500 $ 18,000 $ 11,500 3.450 2007 $ 98,500 61,500 $ 37,000 13,900 2,500 Operating expenses Depreciation expense Interest expense Total expenses Net income before taxes Income taxes at 30% Net income after taxes 1.375 $ 17.775 $ 19,225 5.768 $ 13,457 $ 8,050
Step by Step Solution
There are 3 Steps involved in it

Get step-by-step solutions from verified subject matter experts