

Question: Need help solving and explaining all parts. The graph below shows a company's profit f(x), in dollars, depending on the price of pens x, in
Need help solving and explaining all parts.
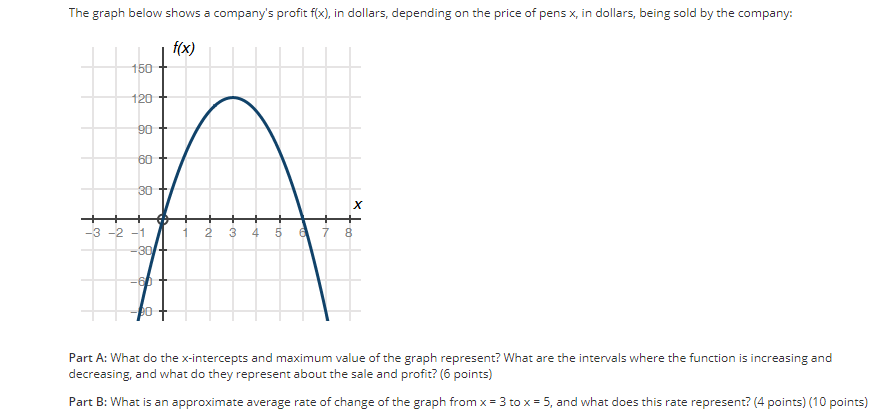
The graph below shows a company's profit f(x), in dollars, depending on the price of pens x, in dollars, being sold by the company: f(x) 150 120 90 60 30 + X T : 3 -2 -1 2 3 4 5 6 7 8 -30/+ 60 Part A: What do the x-intercepts and maximum value of the graph represent? What are the intervals where the function is increasing and decreasing, and what do they represent about the sale and profit? (6 points) Part B: What is an approximate average rate of change of the graph from x = 3 to x = 5, and what does this rate represent? (4 points) (10 points)
Step by Step Solution
There are 3 Steps involved in it
1 Expert Approved Answer
Step: 1 Unlock

Question Has Been Solved by an Expert!
Get step-by-step solutions from verified subject matter experts
Step: 2 Unlock
Step: 3 Unlock