

Question: need help solving, i attached the data as well and showing the answers choices that are available, seriously need help. thank you You are a
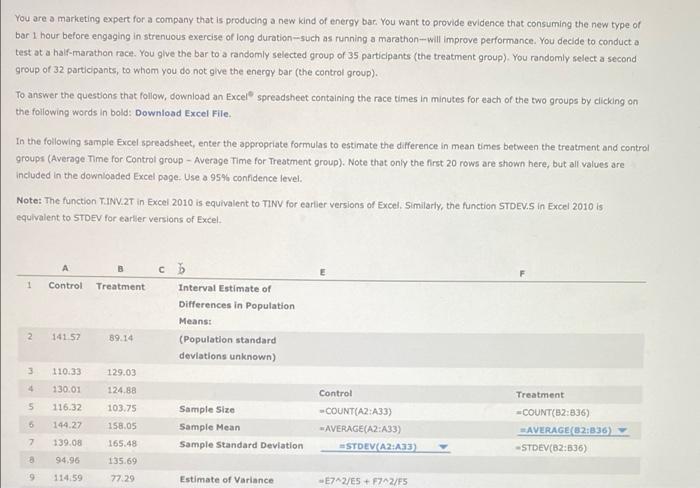
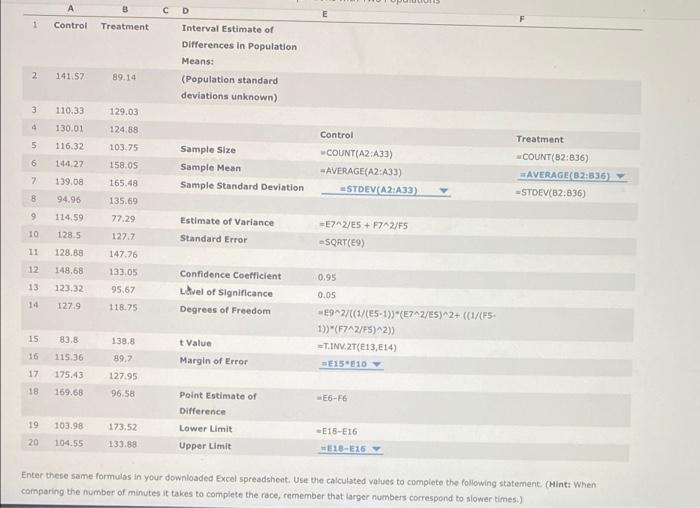
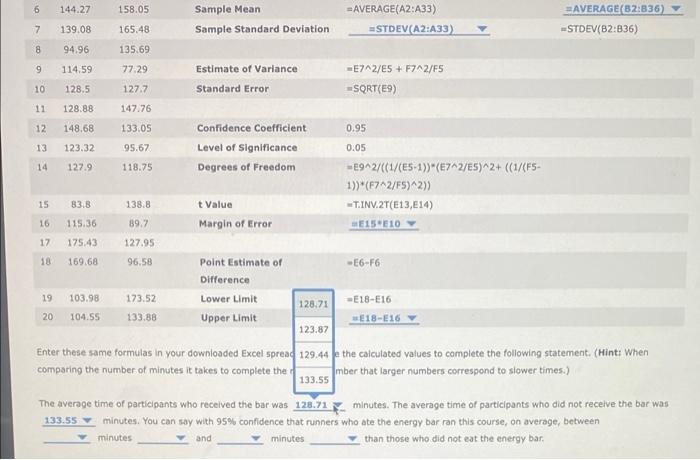
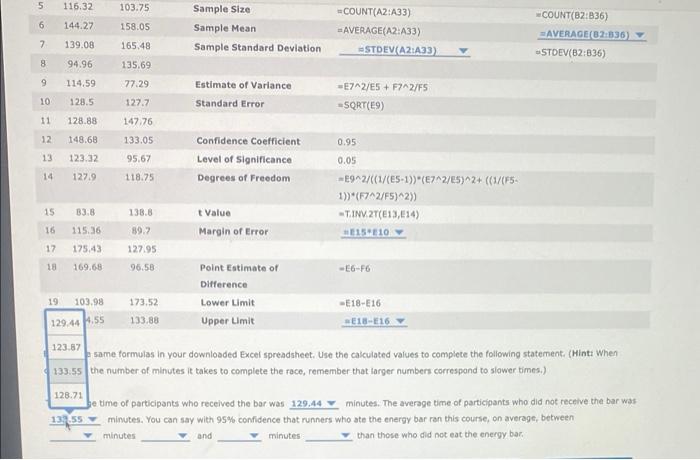
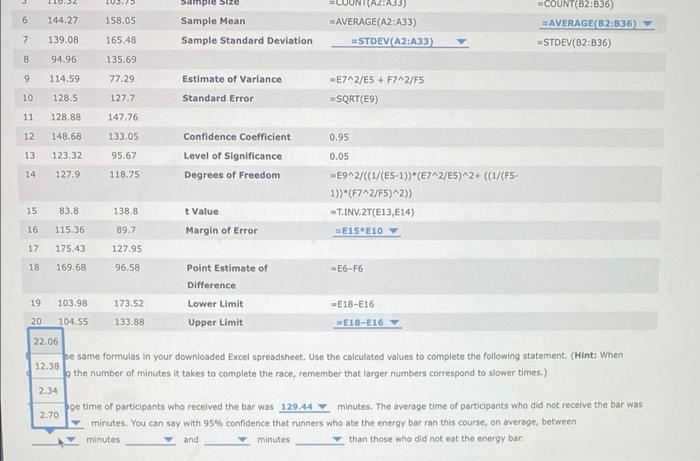
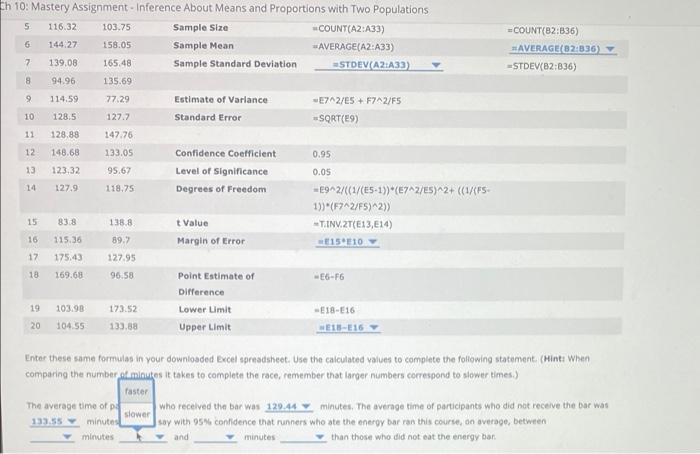
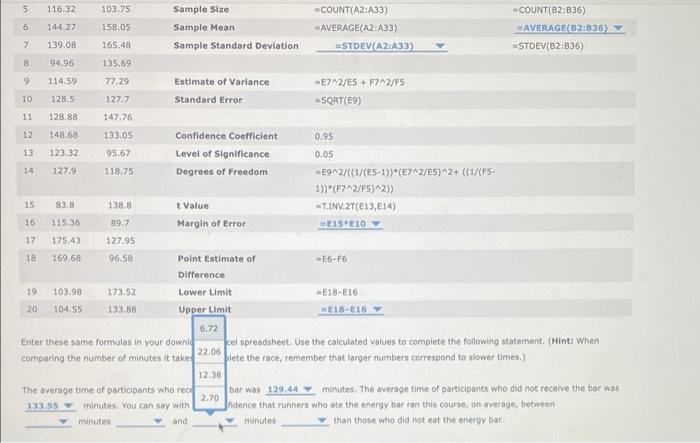
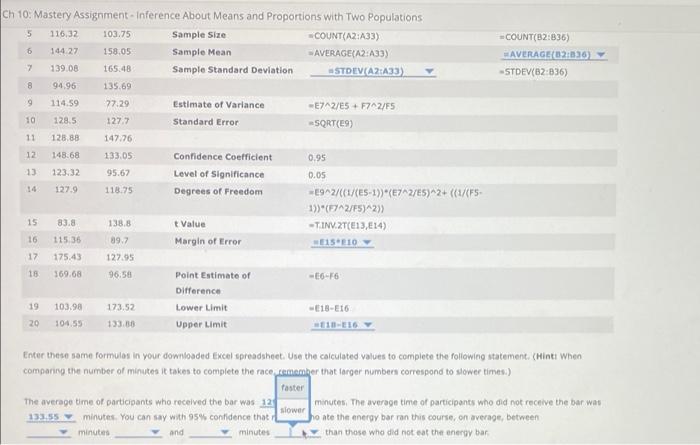
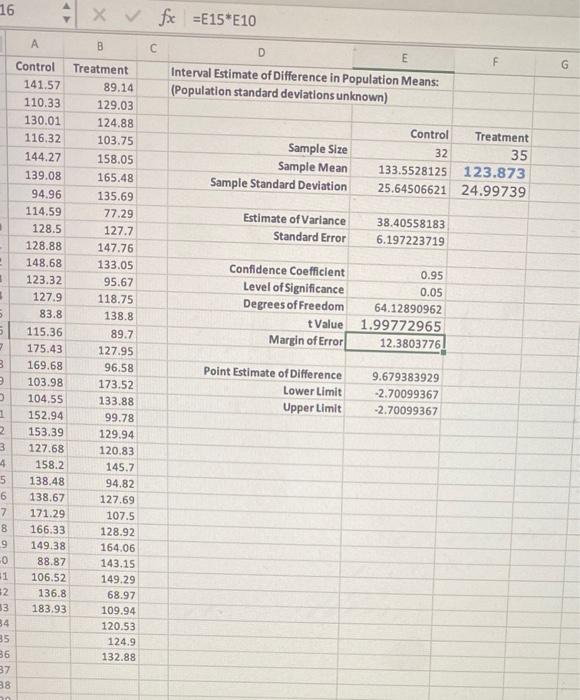
You are a marketing expert for a company that is producing a new kind of energy bar. You want to provide evidence that consuming the new type of bar 1 hour before engaging in strenuous exercise of long duration-such as running a marathon-will improve performance. You decide to conduct a test at a half-marathon race. You give the bar to a randomly selected group of 35 participants (the treatment group). You randomly select a second group of 32 participants, to whom you do not give the energy bar (the control group). spreadsheet containing the race times in minutes for each of the two groups by clicking on To answer the questions that follow, download an Excel the following words in bold: Download Excel File. In the following sample Excel spreadsheet, enter the appropriate formulas to estimate the difference in mean times between the treatment and control groups (Average Time for Control group - Average Time for Treatment group). Note that only the first 20 rows are shown here, but all values are included in the downloaded Excel page. Use a 95% confidence level. Note: The function T.INV.2T in Excel 2010 is equivalent to TINV for earlier versions of Excel. Similarly, the function STDEV.S in Excel 2010 is equivalent to STDEV for earlier versions of Excel. A cb 1 Control Treatment Interval Estimate of Differences in Population Means: 2 141.57 89.14 (Population standard deviations unknown) 3 110.33 129.03 4 130.01 124.88 5 116.32 103.75 Sample Size Treatment COUNT(B2:836) AVERAGE(82:836) 6 144.27 158.05 Sample Mean 7 139.08 165.48 Sample Standard Deviation -STDEV(B2:836) 8 94.96 135.69 9 114.59 77.29 Estimate of Variance Control -COUNT(A2:A33) -AVERAGE(A2:A33) STDEV(A2:A33) -E7^2/E5+ F7^2/F5 CD 1 Control Treatment Interval Estimate of Differences in Population Means: 2 141.57 89.14 (Population standard deviations unknown) 3 110.33 129.03 4 130.01 124.88 5 116.32 103.75 Sample Size 6 144.27 158.05 Sample Mean 7 139.08 165.48 Sample Standard Deviation 8 94.96 135.69 9 114.59 77.29 Estimate of Variance =E7^2/ES + F7^2/F5 10 128.5 127.7 Standard Error =SQRT(E9) 11 128.88 147.76 12 148.68 Confidence Coefficient 0.95 133.05 95.67 118.75 Level of Significance 13 123.32 14 127.9 0.05 Degrees of Freedom -E9^2/((1/(E5-1))*(E7^2/ES)^2+ ((1/(FS- 1))*(F7^2/FS)^2)) 15: 83.8 138.8 t Value T.INV.2T(E13, E14) 16 115.36 Margin of Error =E15 E10 Y 89,7 127.95 17 175.43 18 169.68 96.58 Point Estimate of -E6-F6 Difference 19 103.98 173.52 Lower Limit -E18-E16 20 104.55 133.88 Upper Limit E18-E16 Enter these same formulas in your downloaded Excel spreadsheet. Use the calculated values to complete the following statement. (Hint: When comparing the number of minutes it takes to complete the race, remember that larger numbers correspond to slower times.) Control COUNT(A2:A33) -AVERAGE(A2:A33) STDEV(A2:A33) Treatment COUNT(82:836) AVERAGE(82:836) -STDEV(82:836) 195 6 144.27 158.05 Sample Mean 7 139.08 165.48 Sample Standard Deviation 8 94.96 135.69 9 114.59 77.29 Estimate of Variance =E7^2/E5 + F7^2/F5 10 128.5 127.7 Standard Error =SQRT(E9) 11 128.88 147.76 12 148.68 133.05 Confidence Coefficient 0.95 13 123.32 95.67 Level of Significance 0.05 14 127.9 118.75 Degrees of Freedom -E9^2/((1/(E5-1))*(E7^2/E5)^2+ ((1/(F5- 1))*(F7^2/F5)^2)) 15 83.8 138.8 t Value -T.INV.2T(E13, E14) 115.36 89.7 Margin of Error E15 E10 16 17 175.43 127.95 18 169.68 96.58 Point Estimate of Difference 19 103.98 173.52 Lower Limit 128.71 20 104.55 133.88 Upper Limit E18-E16 123.87 Enter these same formulas in your downloaded Excel spread 129.44 e the calculated values to complete the following statement. (Hint: When comparing the number of minutes it takes to complete the r mber that larger numbers correspond to slower times.) 133.55 The average time of participants who received the bar was 128.71 minutes. The average time of participants who did not receive the bar was minutes. You can say with 95% confidence that runners who ate the energy bar ran this course, on average, between minutes 133.55 and minutes than those who did not eat the energy bar. =AVERAGE(A2:A33) =STDEV(A2:A33) AVERAGE(82:836) =STDEV(82:836) -E6-F6 -E18-E16 5 116.32 103.75 Sample Size 6 144.27 158.05 Sample Mean 7 139.08 165.48 Sample Standard Deviation STDEV(A2:A33) 8 94.96 135.69 9 114.59 77.29. Estimate of Variance -E7^2/E5+ F7^2/FS 10 128.5 127.7 Standard Error =SQRT(E9) 11 128.88 147,76 12 148.68 133.05 Confidence Coefficient 0.95 13 123.32 95.67 Level of significance 0.05 14 127.9 118.75 Degrees of Freedom -E9^2/((1/(E5-1)) (E7^2/E5)^2+ ((1/(F5- 1))*(F7^2/F5)^2)) 15 83.8 138.8 t Value -T.INV 2T(E13, E14) 115.36 Margin of Error #E15 E10 16 17 175.43 18 169.68 89.7 127.95 96.58 Point Estimate of Difference 19 103.98 173.52 Lower Limit 133.88 129.44 4.55 Upper Limit E18-E16 123.87 same formulas in your downloaded Excel spreadsheet. Use the calculated values to complete the following statement. (Hint: When 133.55 the number of minutes it takes to complete the race, remember that larger numbers correspond to slower times.) 128.71 time of participants who received the bar was 129.44 minutes. The average time of participants who did not receive the bar was 132.55 minutes. You can say with 95% confidence that runners who ate the energy bar ran this course, on average, between minutes and minutes than those who did not eat the energy bar. =COUNT(A2:A33) =AVERAGE(A2:A33) -E6-F6 -E18-E16 COUNT(82:836) AVERAGE(82:836) -STDEV(B2:836) 110:32 103.75 sample size 144.27 158.05 Sample Mean 139.08 165.48 Sample Standard Deviation 8 94.96 135.69 9 114.59 77.29 Estimate of Variance -E7^2/E5 + F7^2/F5 10 128.5 127.7 Standard Error =SQRT(E9) 11 128.88 147.76 12 148.68 133.05 Confidence Coefficient 0.95 13 123.32 95.67 Level of significance 0.05 14 127.9 118.75 Degrees of Freedom -E9^2/((1/(ES-1))*(E7^2/E5)^2+ ((1/(FS- 1))*(F7^2/F5)^2)) 15 138.8 t Value =T.INV.2T(E13, E14) 83.8 115.36 Margin of Error =E15 E10 16 17 175.43 89.7 127.95 18 169.68 96.58 Point Estimate of -E6-F6 Difference 173.52 Lower Limit -E18-E16 19 103.98 20 104.55 133.88 Upper Limit =E18-E16 22.06 12.38 se same formulas in your downloaded Excel spreadsheet. Use the calculated values to complete the following statement. (Hint: When o the number of minutes it takes to complete the race, remember that larger numbers correspond to slower times.) 2.34 2.70 age time of participants who received the bar was 129.44 minutes. The average time of participants who did not receive the bar was minutes. You can say with 95% confidence that runners who ate the energy bar ran this course, on average, between minutes and minutes than those who did not eat the energy bar. 6 7 11(A2:A33) =AVERAGE(A2:A33) -COUNT(B2:836) AVERAGE(82:836) -STDEV(B2:836) =STDEV(A2:A33) Ch 10: Mastery Assignment - Inference About Means and Proportions with Two Populations 5 116.32 103.75 Sample Size COUNT(A2:A33) 6 144.27 158.05 Sample Mean AVERAGE(A2:A33) 7 139,08 165.48 Sample Standard Deviation #STDEV(A2:A33) 94.96 135.69 9 114.59 77.29 Estimate of Variance -E7^2/ES + F7^2/F5 10 128.5 127.7 Standard Error =SQRT(E9) 11 128.88 147.76 12 148.68 133.05 Confidence Coefficient 0.95 13 123.32 95.67 Level of significance 0.05 14 127.9 118.75 Degrees of Freedom -E9^2/((1/(E5-1))*(E7^2/ES)^2+ ((1/(FS- 1))*(F7^2/F5)^2)) 15 83.8 138.8 t Value T.INV.2T(E13, E14) 16 115.36 89.7 Margin of Error E15 E10 17 175.43 127.95 18 169.68 96.58 Point Estimate of -E6-F6 Difference 19 103.98 173.52 Lower Limit -E18-E16 20 104.55 133.88 Upper Limit WE18-E16 Enter these same formulas in your downloaded Excel spreadsheet. Use the calculated values to complete the following statement. (Hint: When comparing the number of minutes it takes to complete the race, remember that larger numbers correspond to slower times.) faster The average time of pa who received the bar was 129.44 slower minutes. The average time of participants who did not receive the bar was say with 95% confidence that runners who ate the energy bar ran this course, on average, between 133.55 minutes and minutes than those who did not eat the energy bar minutes =COUNT(82:836) AVERAGE(82:836) -STDEV(82:836) 5 116.32 103.75 6 144.27 158.05 7 139.08 165.48 8 94.96 135.69 9 114.59 77.29 10 128.5 127.7 11 128.88 147.76 12 148.68 133.05 13 123.32 95.67 14 127.9 118.75 15 83.8 138.8 16 115.36 89.7 17 175.43 127.95 18 169.68 96.58 19 103.98 173.52 20 104.55 133,88 Enter these same formulas in your downic comparing the number of minutes it takes The average time of participants who rece 133.55 minutes. You can say with minutes and Sample Size Sample Mean Sample Standard Deviation Estimate of Variance -E7^2/E5+ F7^2/FS Standard Error =SQRT(E9) Confidence Coefficient 0.95 Level of Significance 0.05 Degrees of Freedom -E9^2/((1/(E5-1))*(E7^2/ES)^2+ ((1/(FS- 1))*(F7^2/F5)^2)) t Value T.INV.2T(E13, E14) Margin of Error E15 E10 Point Estimate of Difference Lower Limit Upper Limit E18-E16 6.72 22.06 cel spreadsheet. Use the calculated values to complete the following statement. (Hint: When plete the race, remember that larger numbers correspond to slower times.) 12.38 2.70 bar was 129.44 minutes. The average time of participants who did not receive the bar was fidence that runners who ate the energy bar ran this course, on average, between than those who did not eat the energy bar minutes -COUNT(A2:A33) AVERAGE(A2:A33) =STDEV(A2:A33) -E6-F6 -E18-E16 #COUNT(B2:B36) AVERAGE(82:836) -STDEV(B2:836) Ch 10: Mastery Assignment-Inference About Means and Proportions with Two Populations 5 116,32 103.75 Sample Size COUNT(A2:A33) 6 144.27 158.05 Sample Mean AVERAGE(A2:A33) 7 139.08 165.48 Sample Standard Deviation #STDEV(A2:A33) 8 94.96 135.69 19 114.59 77.29 Estimate of Variance -E7^2/E5+ F7^2/F5 10 128.5 127.7 Standard Error -SQRT(E9) 11 128.88 147.76 12 148.68 133.05 Confidence Coefficient 0.95 13 123.32 95.67 0.05 Level of Significance Degrees of Freedom 127.9 118.75 -E9^2/((1/(E5-1))*(E7^2/ES)^2+ ((1/(FS- 1))*(F7^2/F5)^2)) 15 83.8 138.8 t Value -T.INV.2T(E13,E14) 16 115.36 89.7 Margin of Error E15 E10 17 175.43 127.95 18 169.68 96.58 Point Estimate of -E6-F6 Difference 19 103.98 173.52 Lower Limit -E18-E16 E18-E16 Y 20 104.55 Upper Limit Enter these same formulas in your downloaded Excel spreadsheet. Use the calculated values to complete the following statement. (Hint: When comparing the number of minutes it takes to complete the race, remember that larger numbers correspond to slower times.) faster The average time of participants who received the bar was 12 slower 133.55 minutes. You can say with 95% confidence that r minutes and minutes minutes. The average time of participants who did not receive the bar was ho ate the energy bar ran this course, on average, between than those who did not eat the energy bar -COUNT(B2:835) AVERAGE(B2:836) -STDEV(82:836) 16 1 2 1 3 5 5 2 141.57 110.33 130.01 116.32 144.27 139.08 94.96 114.59 128.5 128.88 148.68 123.32 127.9 83.8 115.36 175.43 169.68 3 103.98 O 104.55 1 152.94 2 153.39 3 127.68 4 158.2 138.48 138.67 171.29 166.33 149.38 88.87 106.52 136.8 183.93 3 5 6 7 8 9 0 31 #2 33 34 35 36 37 38 20 A Control 5678 X fx =E15*E10 C D E F Interval Estimate of Difference in Population Means: (Population standard deviations unknown) Control Treatment Sample Size 32 35 Sample Mean 133.5528125 123.873 Sample Standard Deviation 25.64506621 24.99739 Estimate of Variance 38.40558183 Standard Error 6.197223719 Confidence Coefficient 0.95 Level of Significance 0.05 Degrees of Freedom 64.12890962 t Value 1.99772965 Margin of Error 12.3803776 Point Estimate of Difference 9.679383929 Lower Limit -2.70099367 Upper Limit -2.70099367 B Treatment 89.14 129.03 124.88 103.75 158.05 165.48 135.69 77.29 127.7 147.76 133.05 95.67 118.75 138.8 89.7 127.95 96.58 173.52 133.88 99.78 129.94 120.83 145.7 94.82 127.69 107.5 128.92 164.06 143.15 149.29 68.97 109.94 120.53 124.9 132.88 G You are a marketing expert for a company that is producing a new kind of energy bar. You want to provide evidence that consuming the new type of bar 1 hour before engaging in strenuous exercise of long duration-such as running a marathon-will improve performance. You decide to conduct a test at a half-marathon race. You give the bar to a randomly selected group of 35 participants (the treatment group). You randomly select a second group of 32 participants, to whom you do not give the energy bar (the control group). spreadsheet containing the race times in minutes for each of the two groups by clicking on To answer the questions that follow, download an Excel the following words in bold: Download Excel File. In the following sample Excel spreadsheet, enter the appropriate formulas to estimate the difference in mean times between the treatment and control groups (Average Time for Control group - Average Time for Treatment group). Note that only the first 20 rows are shown here, but all values are included in the downloaded Excel page. Use a 95% confidence level. Note: The function T.INV.2T in Excel 2010 is equivalent to TINV for earlier versions of Excel. Similarly, the function STDEV.S in Excel 2010 is equivalent to STDEV for earlier versions of Excel. A cb 1 Control Treatment Interval Estimate of Differences in Population Means: 2 141.57 89.14 (Population standard deviations unknown) 3 110.33 129.03 4 130.01 124.88 5 116.32 103.75 Sample Size Treatment COUNT(B2:836) AVERAGE(82:836) 6 144.27 158.05 Sample Mean 7 139.08 165.48 Sample Standard Deviation -STDEV(B2:836) 8 94.96 135.69 9 114.59 77.29 Estimate of Variance Control -COUNT(A2:A33) -AVERAGE(A2:A33) STDEV(A2:A33) -E7^2/E5+ F7^2/F5 CD 1 Control Treatment Interval Estimate of Differences in Population Means: 2 141.57 89.14 (Population standard deviations unknown) 3 110.33 129.03 4 130.01 124.88 5 116.32 103.75 Sample Size 6 144.27 158.05 Sample Mean 7 139.08 165.48 Sample Standard Deviation 8 94.96 135.69 9 114.59 77.29 Estimate of Variance =E7^2/ES + F7^2/F5 10 128.5 127.7 Standard Error =SQRT(E9) 11 128.88 147.76 12 148.68 Confidence Coefficient 0.95 133.05 95.67 118.75 Level of Significance 13 123.32 14 127.9 0.05 Degrees of Freedom -E9^2/((1/(E5-1))*(E7^2/ES)^2+ ((1/(FS- 1))*(F7^2/FS)^2)) 15: 83.8 138.8 t Value T.INV.2T(E13, E14) 16 115.36 Margin of Error =E15 E10 Y 89,7 127.95 17 175.43 18 169.68 96.58 Point Estimate of -E6-F6 Difference 19 103.98 173.52 Lower Limit -E18-E16 20 104.55 133.88 Upper Limit E18-E16 Enter these same formulas in your downloaded Excel spreadsheet. Use the calculated values to complete the following statement. (Hint: When comparing the number of minutes it takes to complete the race, remember that larger numbers correspond to slower times.) Control COUNT(A2:A33) -AVERAGE(A2:A33) STDEV(A2:A33) Treatment COUNT(82:836) AVERAGE(82:836) -STDEV(82:836) 195 6 144.27 158.05 Sample Mean 7 139.08 165.48 Sample Standard Deviation 8 94.96 135.69 9 114.59 77.29 Estimate of Variance =E7^2/E5 + F7^2/F5 10 128.5 127.7 Standard Error =SQRT(E9) 11 128.88 147.76 12 148.68 133.05 Confidence Coefficient 0.95 13 123.32 95.67 Level of Significance 0.05 14 127.9 118.75 Degrees of Freedom -E9^2/((1/(E5-1))*(E7^2/E5)^2+ ((1/(F5- 1))*(F7^2/F5)^2)) 15 83.8 138.8 t Value -T.INV.2T(E13, E14) 115.36 89.7 Margin of Error E15 E10 16 17 175.43 127.95 18 169.68 96.58 Point Estimate of Difference 19 103.98 173.52 Lower Limit 128.71 20 104.55 133.88 Upper Limit E18-E16 123.87 Enter these same formulas in your downloaded Excel spread 129.44 e the calculated values to complete the following statement. (Hint: When comparing the number of minutes it takes to complete the r mber that larger numbers correspond to slower times.) 133.55 The average time of participants who received the bar was 128.71 minutes. The average time of participants who did not receive the bar was minutes. You can say with 95% confidence that runners who ate the energy bar ran this course, on average, between minutes 133.55 and minutes than those who did not eat the energy bar. =AVERAGE(A2:A33) =STDEV(A2:A33) AVERAGE(82:836) =STDEV(82:836) -E6-F6 -E18-E16 5 116.32 103.75 Sample Size 6 144.27 158.05 Sample Mean 7 139.08 165.48 Sample Standard Deviation STDEV(A2:A33) 8 94.96 135.69 9 114.59 77.29. Estimate of Variance -E7^2/E5+ F7^2/FS 10 128.5 127.7 Standard Error =SQRT(E9) 11 128.88 147,76 12 148.68 133.05 Confidence Coefficient 0.95 13 123.32 95.67 Level of significance 0.05 14 127.9 118.75 Degrees of Freedom -E9^2/((1/(E5-1)) (E7^2/E5)^2+ ((1/(F5- 1))*(F7^2/F5)^2)) 15 83.8 138.8 t Value -T.INV 2T(E13, E14) 115.36 Margin of Error #E15 E10 16 17 175.43 18 169.68 89.7 127.95 96.58 Point Estimate of Difference 19 103.98 173.52 Lower Limit 133.88 129.44 4.55 Upper Limit E18-E16 123.87 same formulas in your downloaded Excel spreadsheet. Use the calculated values to complete the following statement. (Hint: When 133.55 the number of minutes it takes to complete the race, remember that larger numbers correspond to slower times.) 128.71 time of participants who received the bar was 129.44 minutes. The average time of participants who did not receive the bar was 132.55 minutes. You can say with 95% confidence that runners who ate the energy bar ran this course, on average, between minutes and minutes than those who did not eat the energy bar. =COUNT(A2:A33) =AVERAGE(A2:A33) -E6-F6 -E18-E16 COUNT(82:836) AVERAGE(82:836) -STDEV(B2:836) 110:32 103.75 sample size 144.27 158.05 Sample Mean 139.08 165.48 Sample Standard Deviation 8 94.96 135.69 9 114.59 77.29 Estimate of Variance -E7^2/E5 + F7^2/F5 10 128.5 127.7 Standard Error =SQRT(E9) 11 128.88 147.76 12 148.68 133.05 Confidence Coefficient 0.95 13 123.32 95.67 Level of significance 0.05 14 127.9 118.75 Degrees of Freedom -E9^2/((1/(ES-1))*(E7^2/E5)^2+ ((1/(FS- 1))*(F7^2/F5)^2)) 15 138.8 t Value =T.INV.2T(E13, E14) 83.8 115.36 Margin of Error =E15 E10 16 17 175.43 89.7 127.95 18 169.68 96.58 Point Estimate of -E6-F6 Difference 173.52 Lower Limit -E18-E16 19 103.98 20 104.55 133.88 Upper Limit =E18-E16 22.06 12.38 se same formulas in your downloaded Excel spreadsheet. Use the calculated values to complete the following statement. (Hint: When o the number of minutes it takes to complete the race, remember that larger numbers correspond to slower times.) 2.34 2.70 age time of participants who received the bar was 129.44 minutes. The average time of participants who did not receive the bar was minutes. You can say with 95% confidence that runners who ate the energy bar ran this course, on average, between minutes and minutes than those who did not eat the energy bar. 6 7 11(A2:A33) =AVERAGE(A2:A33) -COUNT(B2:836) AVERAGE(82:836) -STDEV(B2:836) =STDEV(A2:A33) Ch 10: Mastery Assignment - Inference About Means and Proportions with Two Populations 5 116.32 103.75 Sample Size COUNT(A2:A33) 6 144.27 158.05 Sample Mean AVERAGE(A2:A33) 7 139,08 165.48 Sample Standard Deviation #STDEV(A2:A33) 94.96 135.69 9 114.59 77.29 Estimate of Variance -E7^2/ES + F7^2/F5 10 128.5 127.7 Standard Error =SQRT(E9) 11 128.88 147.76 12 148.68 133.05 Confidence Coefficient 0.95 13 123.32 95.67 Level of significance 0.05 14 127.9 118.75 Degrees of Freedom -E9^2/((1/(E5-1))*(E7^2/ES)^2+ ((1/(FS- 1))*(F7^2/F5)^2)) 15 83.8 138.8 t Value T.INV.2T(E13, E14) 16 115.36 89.7 Margin of Error E15 E10 17 175.43 127.95 18 169.68 96.58 Point Estimate of -E6-F6 Difference 19 103.98 173.52 Lower Limit -E18-E16 20 104.55 133.88 Upper Limit WE18-E16 Enter these same formulas in your downloaded Excel spreadsheet. Use the calculated values to complete the following statement. (Hint: When comparing the number of minutes it takes to complete the race, remember that larger numbers correspond to slower times.) faster The average time of pa who received the bar was 129.44 slower minutes. The average time of participants who did not receive the bar was say with 95% confidence that runners who ate the energy bar ran this course, on average, between 133.55 minutes and minutes than those who did not eat the energy bar minutes =COUNT(82:836) AVERAGE(82:836) -STDEV(82:836) 5 116.32 103.75 6 144.27 158.05 7 139.08 165.48 8 94.96 135.69 9 114.59 77.29 10 128.5 127.7 11 128.88 147.76 12 148.68 133.05 13 123.32 95.67 14 127.9 118.75 15 83.8 138.8 16 115.36 89.7 17 175.43 127.95 18 169.68 96.58 19 103.98 173.52 20 104.55 133,88 Enter these same formulas in your downic comparing the number of minutes it takes The average time of participants who rece 133.55 minutes. You can say with minutes and Sample Size Sample Mean Sample Standard Deviation Estimate of Variance -E7^2/E5+ F7^2/FS Standard Error =SQRT(E9) Confidence Coefficient 0.95 Level of Significance 0.05 Degrees of Freedom -E9^2/((1/(E5-1))*(E7^2/ES)^2+ ((1/(FS- 1))*(F7^2/F5)^2)) t Value T.INV.2T(E13, E14) Margin of Error E15 E10 Point Estimate of Difference Lower Limit Upper Limit E18-E16 6.72 22.06 cel spreadsheet. Use the calculated values to complete the following statement. (Hint: When plete the race, remember that larger numbers correspond to slower times.) 12.38 2.70 bar was 129.44 minutes. The average time of participants who did not receive the bar was fidence that runners who ate the energy bar ran this course, on average, between than those who did not eat the energy bar minutes -COUNT(A2:A33) AVERAGE(A2:A33) =STDEV(A2:A33) -E6-F6 -E18-E16 #COUNT(B2:B36) AVERAGE(82:836) -STDEV(B2:836) Ch 10: Mastery Assignment-Inference About Means and Proportions with Two Populations 5 116,32 103.75 Sample Size COUNT(A2:A33) 6 144.27 158.05 Sample Mean AVERAGE(A2:A33) 7 139.08 165.48 Sample Standard Deviation #STDEV(A2:A33) 8 94.96 135.69 19 114.59 77.29 Estimate of Variance -E7^2/E5+ F7^2/F5 10 128.5 127.7 Standard Error -SQRT(E9) 11 128.88 147.76 12 148.68 133.05 Confidence Coefficient 0.95 13 123.32 95.67 0.05 Level of Significance Degrees of Freedom 127.9 118.75 -E9^2/((1/(E5-1))*(E7^2/ES)^2+ ((1/(FS- 1))*(F7^2/F5)^2)) 15 83.8 138.8 t Value -T.INV.2T(E13,E14) 16 115.36 89.7 Margin of Error E15 E10 17 175.43 127.95 18 169.68 96.58 Point Estimate of -E6-F6 Difference 19 103.98 173.52 Lower Limit -E18-E16 E18-E16 Y 20 104.55 Upper Limit Enter these same formulas in your downloaded Excel spreadsheet. Use the calculated values to complete the following statement. (Hint: When comparing the number of minutes it takes to complete the race, remember that larger numbers correspond to slower times.) faster The average time of participants who received the bar was 12 slower 133.55 minutes. You can say with 95% confidence that r minutes and minutes minutes. The average time of participants who did not receive the bar was ho ate the energy bar ran this course, on average, between than those who did not eat the energy bar -COUNT(B2:835) AVERAGE(B2:836) -STDEV(82:836) 16 1 2 1 3 5 5 2 141.57 110.33 130.01 116.32 144.27 139.08 94.96 114.59 128.5 128.88 148.68 123.32 127.9 83.8 115.36 175.43 169.68 3 103.98 O 104.55 1 152.94 2 153.39 3 127.68 4 158.2 138.48 138.67 171.29 166.33 149.38 88.87 106.52 136.8 183.93 3 5 6 7 8 9 0 31 #2 33 34 35 36 37 38 20 A Control 5678 X fx =E15*E10 C D E F Interval Estimate of Difference in Population Means: (Population standard deviations unknown) Control Treatment Sample Size 32 35 Sample Mean 133.5528125 123.873 Sample Standard Deviation 25.64506621 24.99739 Estimate of Variance 38.40558183 Standard Error 6.197223719 Confidence Coefficient 0.95 Level of Significance 0.05 Degrees of Freedom 64.12890962 t Value 1.99772965 Margin of Error 12.3803776 Point Estimate of Difference 9.679383929 Lower Limit -2.70099367 Upper Limit -2.70099367 B Treatment 89.14 129.03 124.88 103.75 158.05 165.48 135.69 77.29 127.7 147.76 133.05 95.67 118.75 138.8 89.7 127.95 96.58 173.52 133.88 99.78 129.94 120.83 145.7 94.82 127.69 107.5 128.92 164.06 143.15 149.29 68.97 109.94 120.53 124.9 132.88 G
Step by Step Solution
There are 3 Steps involved in it

Get step-by-step solutions from verified subject matter experts