

Question: need help solving j1, j2, k1 Hercules Exercise Equipment Co. purchased a computerized measuring device two years ago for $94.000. The equipment falls into the
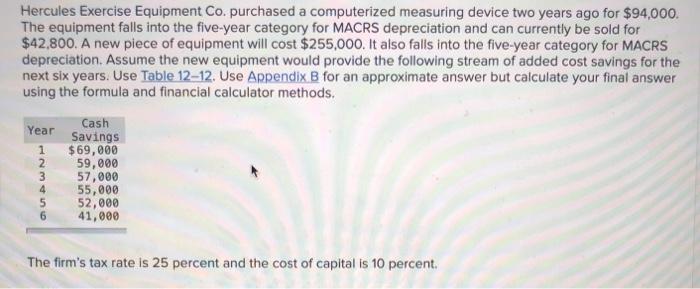
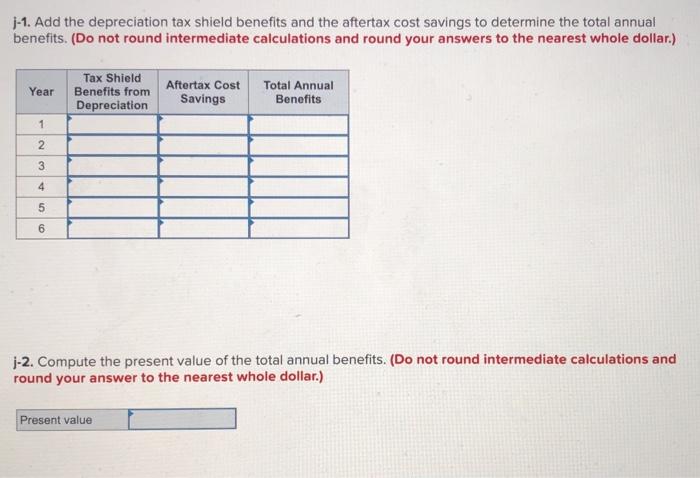
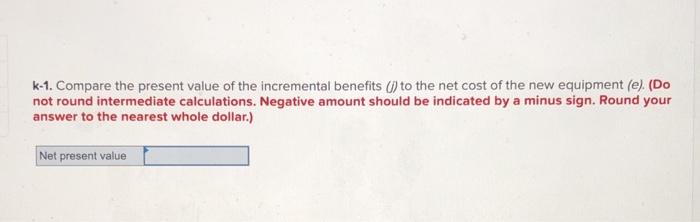
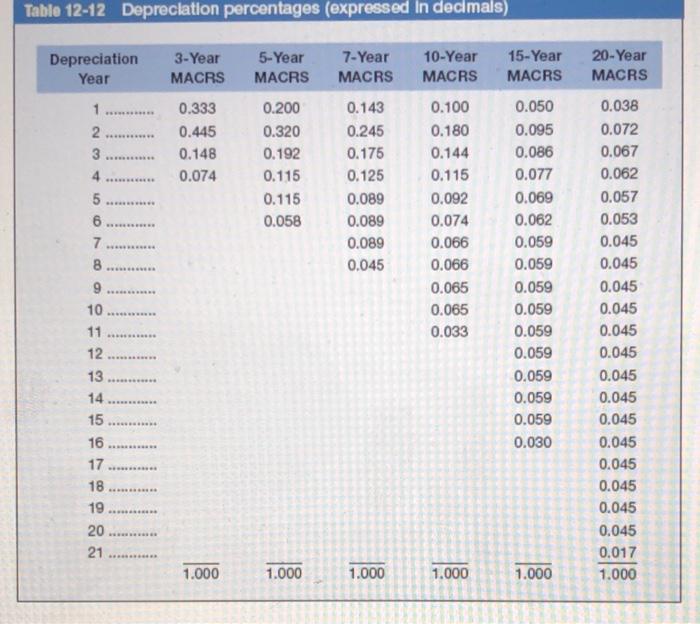
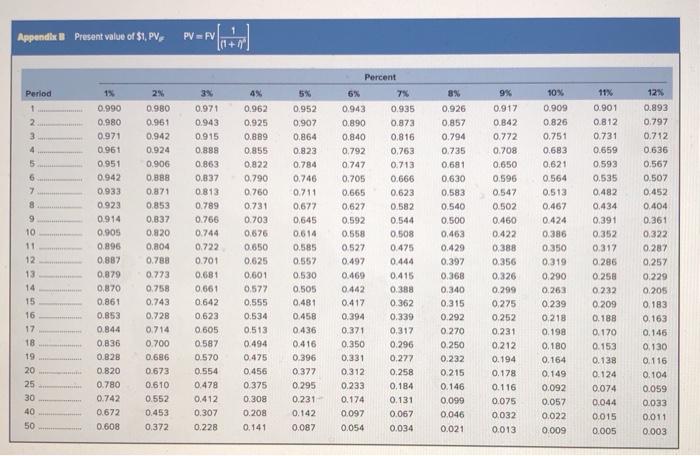
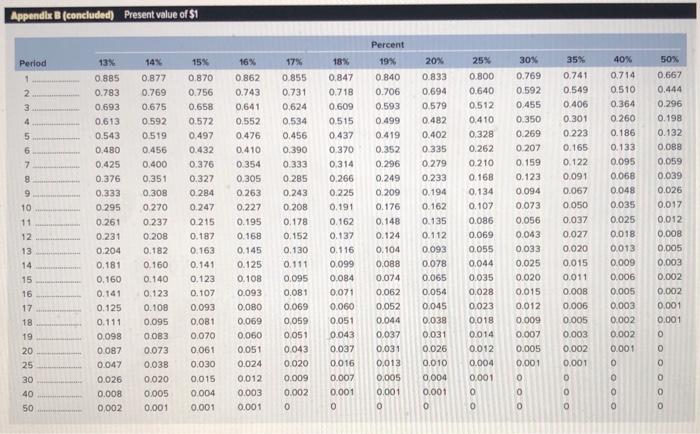
Hercules Exercise Equipment Co. purchased a computerized measuring device two years ago for $94.000. The equipment falls into the five-year category for MACRS depreciation and can currently be sold for $42,800. A new piece of equipment will cost $255,000. It also falls into the five-year category for MACRS depreciation. Assume the new equipment would provide the following stream of added cost savings for the next six years. Use Table 12-12. Use Appendix B for an approximate answer but calculate your final answer using the formula and financial calculator methods. Year 1 2 3 4 5 6 Cash Savings $69,000 59,000 57,000 55,000 52,000 41,000 The firm's tax rate is 25 percent and the cost of capital is 10 percent. 1-1. Add the depreciation tax shield benefits and the aftertax cost savings to determine the total annual benefits. (Do not round intermediate calculations and round your answers to the nearest whole dollar.) Year Tax Shield Benefits from Depreciation Aftertax Cost Savings Total Annual Benefits 1 2 3 4 5 6 j-2. Compute the present value of the total annual benefits. (Do not round intermediate calculations and round your answer to the nearest whole dollar.) Present value k-1. Compare the present value of the incremental benefits (1) to the net cost of the new equipment (e), (Do not round intermediate calculations. Negative amount should be indicated by a minus sign. Round your answer to the nearest whole dollar.) Net present value Table 12-12 Depreciation percentages (expressed in decimals) Depreciation Year 3-Year MACRS 5-Year MACRS 7-Year MACRS 10-Year MACRS 20-Year MACRS 1 2 3........... 4 5 6 7 8 0.333 0.200 0.445 0.320 0.148 0.192 0.074 0.115 0.115 0.058 0.143 0.245 0.175 0.125 0.089 0.089 0.089 0.045 0.100 0.180 0.144 0.115 0.092 0.074 0.066 0.066 0.065 0.065 0.033 15-Year MACRS 0.050 0.095 0.086 0.077 0.069 0.062 0.059 0.059 0.059 0.059 0.059 0.059 0.059 0.059 0.059 0.030 9 10 11 12 13 14 15 16 17 18 19 20 21 0.038 0.072 0.067 0.062 0.057 0.053 0.045 0.045 0.045 0.045 0.045 0.045 0.045 0.045 0.045 0.045 0.045 0.045 0.045 0.045 0.017 1.000 1.000 1.000 1.000 1.000 1.000 Appendix & Present value of $1, PV PVFV M10 + r) Period 15 4% 1 2 3 4 5 6 7 9 10 11 12 13 14 15 16 17 18 19 20 25 30 40 50 0.990 0.980 0.971 0.961 0.951 0.942 0.933 0.923 0.914 0.905 0.896 0.887 0.879 0.870 0.861 0.853 0.844 0.836 0.828 0.820 0.780 0.742 0.672 0.608 2% 0.980 0.961 0.942 0.924 0.906 0,888 0.871 0.853 0.837 0.820 0,804 0.788 0.773 0.758 0.743 0.728 0.714 0.700 0.686 0.673 0.610 0.552 0.453 0.372 0.971 0.943 0.915 0.888 0.863 0.837 0813 0.789 0.766 0.744 0.722 0.701 0.681 0.661 0642 0.623 0.605 0.587 0.570 0.554 0.478 0.412 0.307 0.228 0.962 0.925 0.889 0.855 0.822 0.790 0.760 0.731 0.703 0.676 0.650 0.625 0.601 0.577 0.555 0.534 0.513 0.494 0.475 0.456 0.375 0.308 0.208 0.141 0.952 0.907 0.864 0.823 0.784 0.746 0.711 0,672 0,645 0.614 0.585 0.552 0.530 0,505 0.481 0.458 0.436 0.416 0.396 0.377 0.295 0.231 0.142 0.087 Percent 6% 7% 0.943 0.935 0.890 0.873 0.840 0,816 0.792 0.763 0.747 0.713 0.705 0.666 0.665 0.623 0,627 0.582 0.592 0.544 0.558 0.508 0.527 0.475 0.497 0.444 0.469 0.415 0.442 0.388 0.417 0.362 0.394 0.339 0.371 0,317 0.350 0.296 0.331 0.277 0.312 0.258 0.233 0.184 0.174 0.131 0.097 0.067 0.054 0.034 8% 0.926 0.857 0.794 0.735 0.681 0.630 0.583 0.540 0.500 0,463 0.429 0.397 0.368 0.340 0.315 0.292 0.270 0.250 0.232 0.215 0.146 0.099 0.046 0.021 9% 0.917 0.842 0.772 0.708 0.650 0.596 0.547 0.502 0.460 0.422 0,388 0.356 0.326 0.299 0.275 0.252 0.231 0.212 0.194 0.178 0.116 0.075 0.032 0.013 10% 0.909 0.826 0.751 0.683 0.621 0.564 0.513 0.467 0.424 0.386 0.350 0.319 0.290 0.263 0.239 0.218 0.198 0.180 0.164 0.149 0.092 0.057 0.022 0.009 11% 0.901 0.812 0.731 0.659 0.593 0.535 0.482 0.434 0.391 0.352 0.317 0.286 0.258 0.232 0.209 0.188 0.170 0.153 0.138 0.124 0.074 0.044 0.015 0.005 12% 0.893 0.797 0.712 0.636 0.567 0.507 0.452 0.404 0.361 0.322 0.287 0.257 0.229 0.205 0.183 0.163 0.146 0.130 0.116 0.104 0.059 0.033 0.011 0.003 Appendix B (concluded) Present value of $1 Percent 19% 13% 18% 50% Period 1 2 3 4 5 6 7 8 9 10 11 12 13 14 15 0. BBS 0.783 0.693 0.613 0.543 0.480 0.425 0.376 0.333 0.295 0.261 0.231 0.204 0.181 0.160 0.141 0.125 0.111 0,098 0.087 0.047 0.026 0.008 0,002 14% 0.877 0.769 0.675 0.592 0.519 0.456 0.400 0,351 0.308 0.270 0.237 0:208 0.182 0.160 0.140 0.123 0.108 0.095 0.073 0.03B 0.020 0.005 0.001 15% 0.870 0.756 0.658 0.572 0.497 0.432 0.376 0.327 0.284 0.247 0215 0.187 0.163 0.141 0.123 0.107 0.093 0,081 0.070 0.061 0.030 0.015 0.004 0.001 16% 0.862 0.743 0.641 0.552 0.476 0.410 0.354 0.305 0.263 0.227 0.195 0.168 0.145 0.125 0.108 0.093 0.080 0.069 0.060 0.051 0.024 0,012 0.003 0.001 17% 0.855 0.731 0.624 0.534 0.456 0.390 0.333 0.285 0.243 0.208 0.178 0.152 0.130 0.111 0.095 0.081 0.069 0.059 0.051 0.043 0.847 0.718 0.609 0515 0.437 0.370 0.314 0.266 0.225 0.191 0.162 0.137 0.116 0.099 0.084 0.071 0.060 0.051 0.043 0.037 0.016 0.007 0.001 0 0.840 0.706 0.593 0.499 0.419 0.352 0.296 0.249 0.209 0.176 0.148 0.124 0.104 0.088 0.074 0.062 0.052 0.044 0.037 0.031 0.013 0.005 0.001 20% 0.833 0.694 0.579 0.482 0.402 0.335 0.279 0.233 0.194 0.162 0.135 0.112 0.093 0.078 0.065 0.054 0.045 0.038 0.031 0.026 0.010 0.004 0.001 25% 0800 0.640 0,512 0.410 0.328 0.262 0.210 0.168 0.134 0.107 0.086 0,069 0.055 0.044 0.035 0.028 0,023 0.018 0.014 0.012 0.004 0.001 30% 0.769 0.592 0.455 0.350 0.269 0.207 0.159 0.123 0.094 0.073 0.056 0.043 0.033 0.025 0.020 0.015 0.012 0.009 0.007 0.005 0.001 35% 0.741 0.549 0.406 0.301 0.223 0.165 0.122 0.091 0.067 0.050 0.037 0,027 0.020 0.015 0.011 0.008 0.006 0.005 0.003 0.002 0.001 0 40% 0.714 0.510 0.364 0.260 0.186 0.133 0.095 0.068 0.048 0.035 0.025 0.018 0.013 0.009 0.006 0.005 0.003 0.002 0.002 0.001 0.667 0.444 0.296 0.198 0.132 0.088 0.059 0.039 0.026 0.017 0.012 0.008 0.005 0.003 0.002 0.002 0.001 0.001 16 17 18 19 20 25 30 40 50 0.020 0.009 0.002 0
Step by Step Solution
There are 3 Steps involved in it

Get step-by-step solutions from verified subject matter experts