

Question: need help solving question 3) a,b and c (D) (5x 32)2 3. [12 points] The following table shows the value of the S&P 500 Index
need help solving question 3) a,b and c
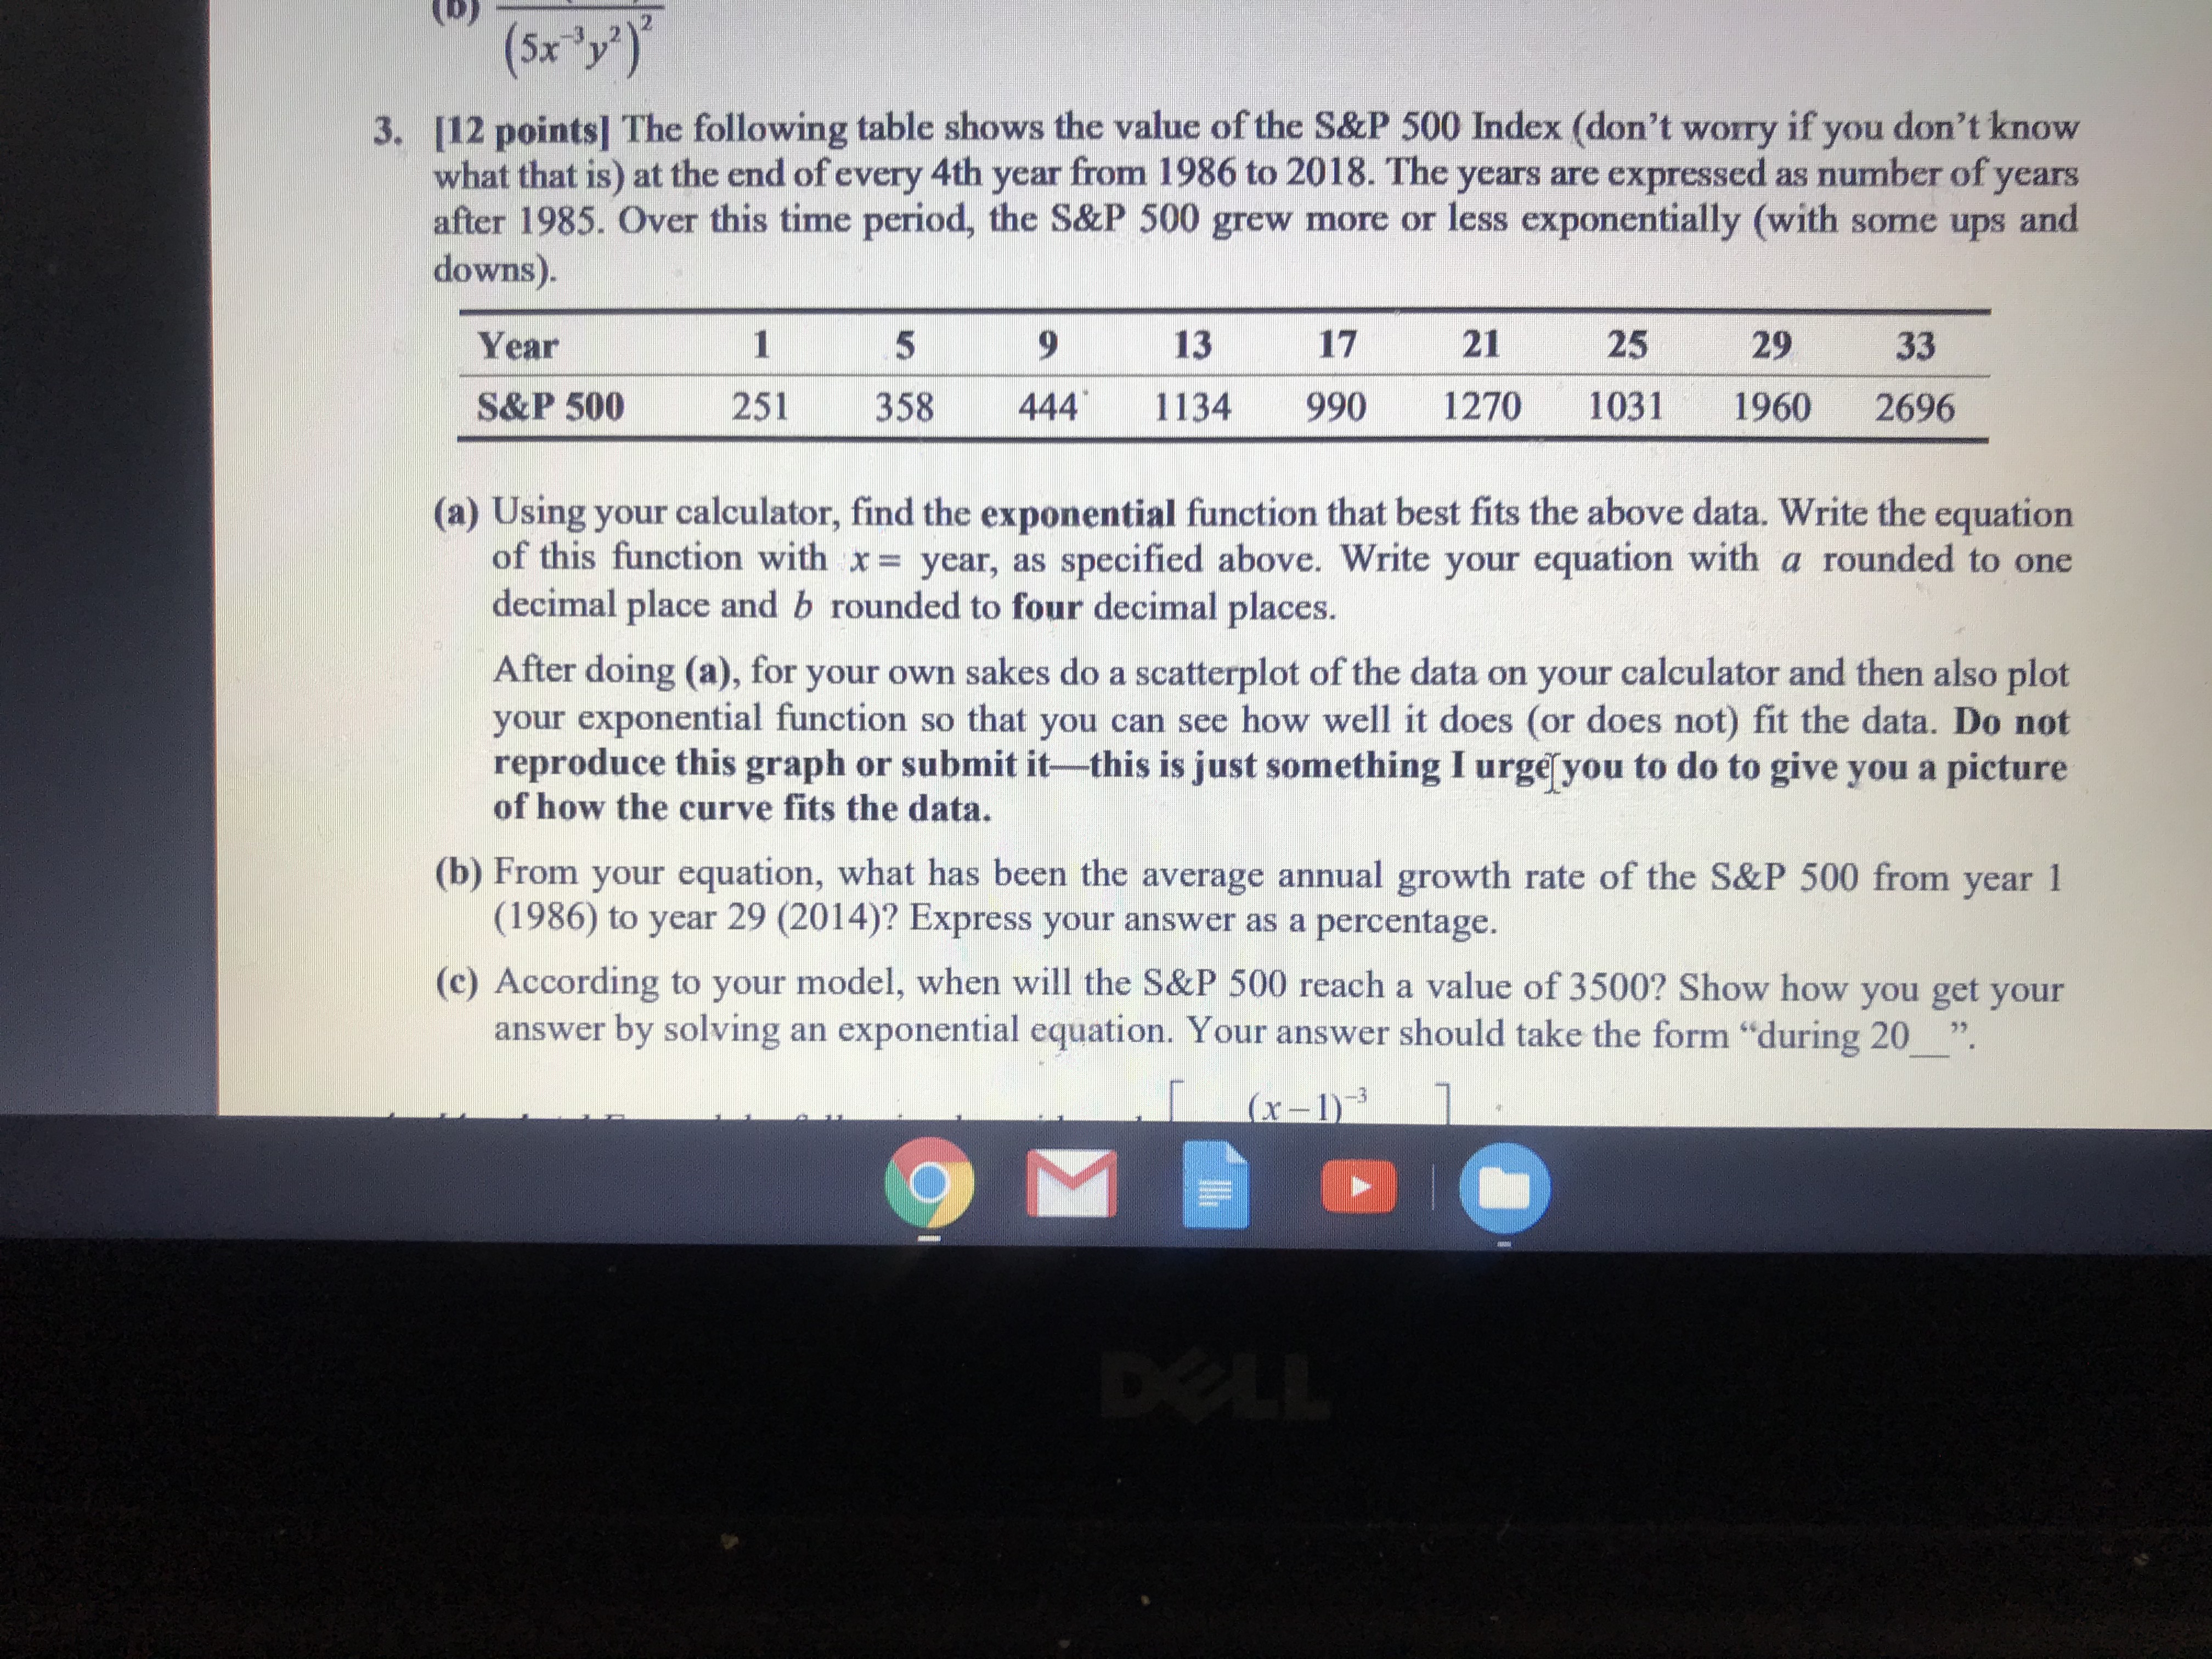
(D) (5x 32)2 3. [12 points] The following table shows the value of the S&P 500 Index (don't worry if you don't know what that is) at the end of every 4th year from 1986 to 2018. The years are expressed as number of years after 1985. Over this time period, the S&P 500 grew more or less exponentially (with some ups and downs). Year 5 9 13 17 21 25 29 33 S&P 500 251 358 444 1134 990 1270 1031 1960 2696 (a) Using your calculator, find the exponential function that best fits the above data. Write the equation of this function with x = year, as specified above. Write your equation with a rounded to one decimal place and b rounded to four decimal places. After doing (a), for your own sakes do a scatterplot of the data on your calculator and then also plot your exponential function so that you can see how well it does (or does not) fit the data. Do not reproduce this graph or submit it-this is just something I urge you to do to give you a picture of how the curve fits the data. (b) From your equation, what has been the average annual growth rate of the S&P 500 from year 1 (1986) to year 29 (2014)? Express your answer as a percentage. (c) According to your model, when will the S&P 500 reach a value of 3500? Show how you get your answer by solving an exponential equation. Your answer should take the form "during 20 (x - 1)3 DELL
Step by Step Solution
There are 3 Steps involved in it

Get step-by-step solutions from verified subject matter experts