

Question: Need help solving this two question, using my mathlab graphing tool. Use the graph of y = e* and transformations to sketch the exponential function
Need help solving this two question, using my mathlab graphing tool.


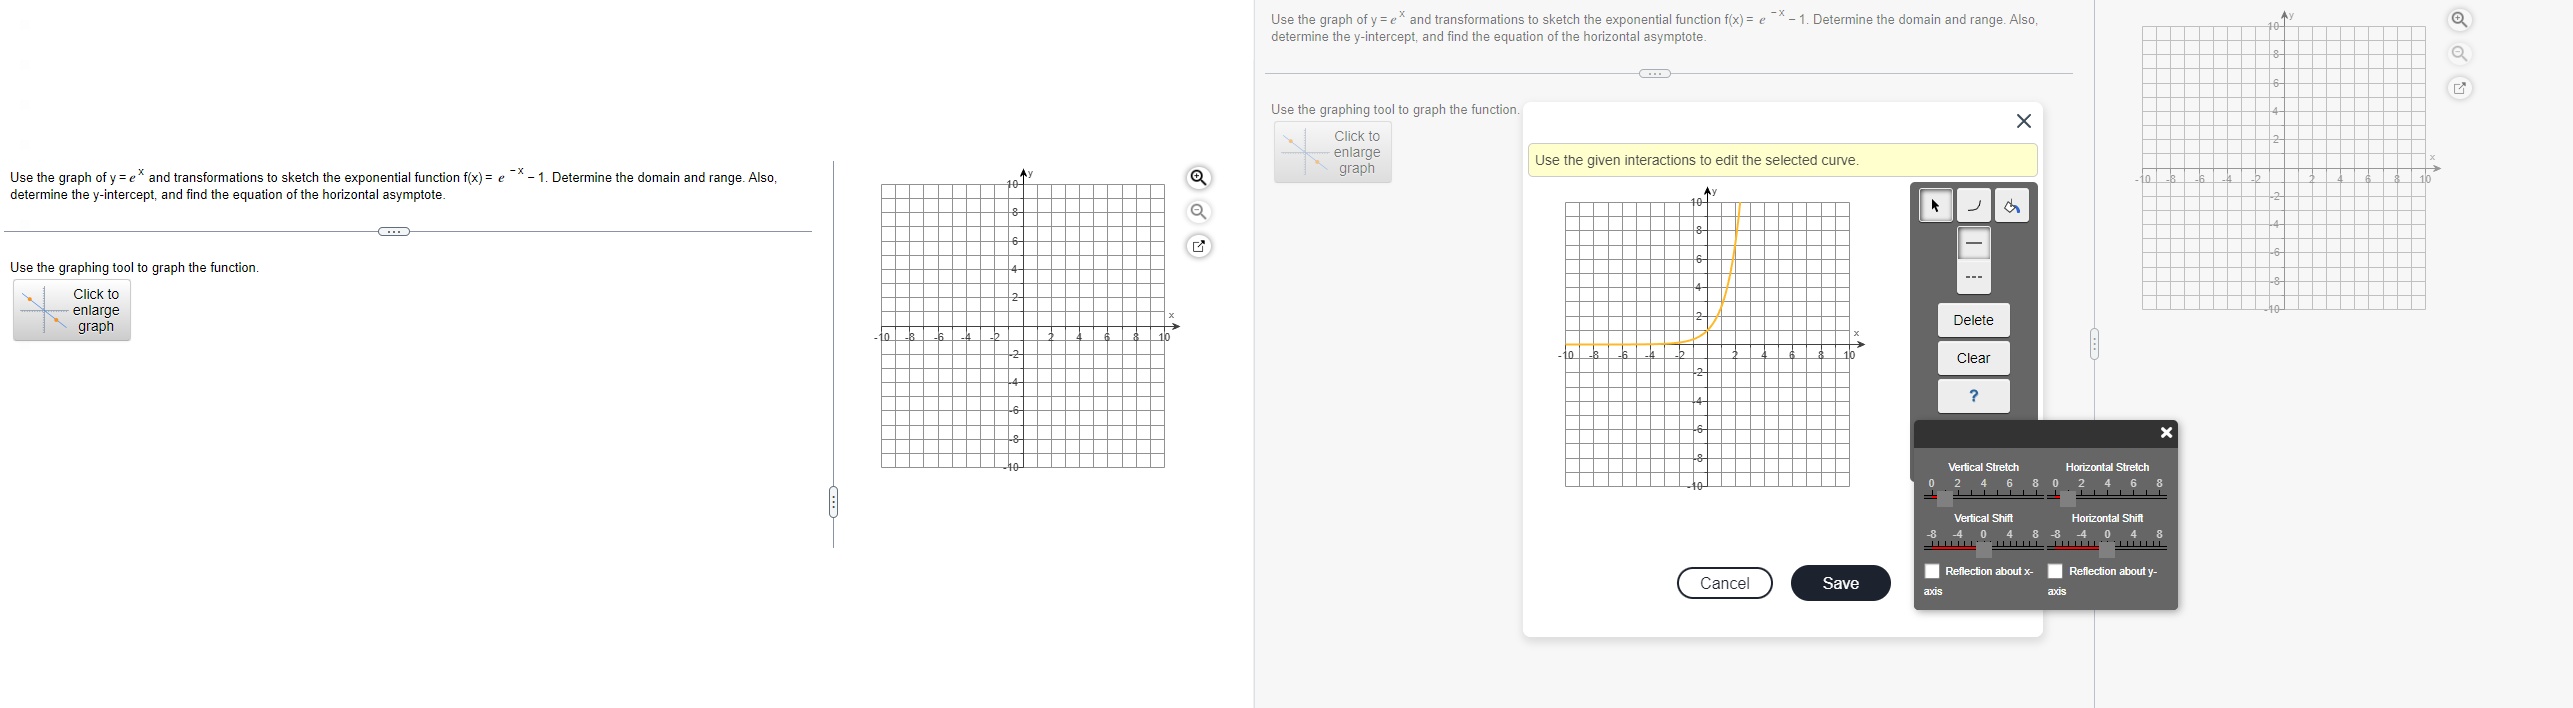
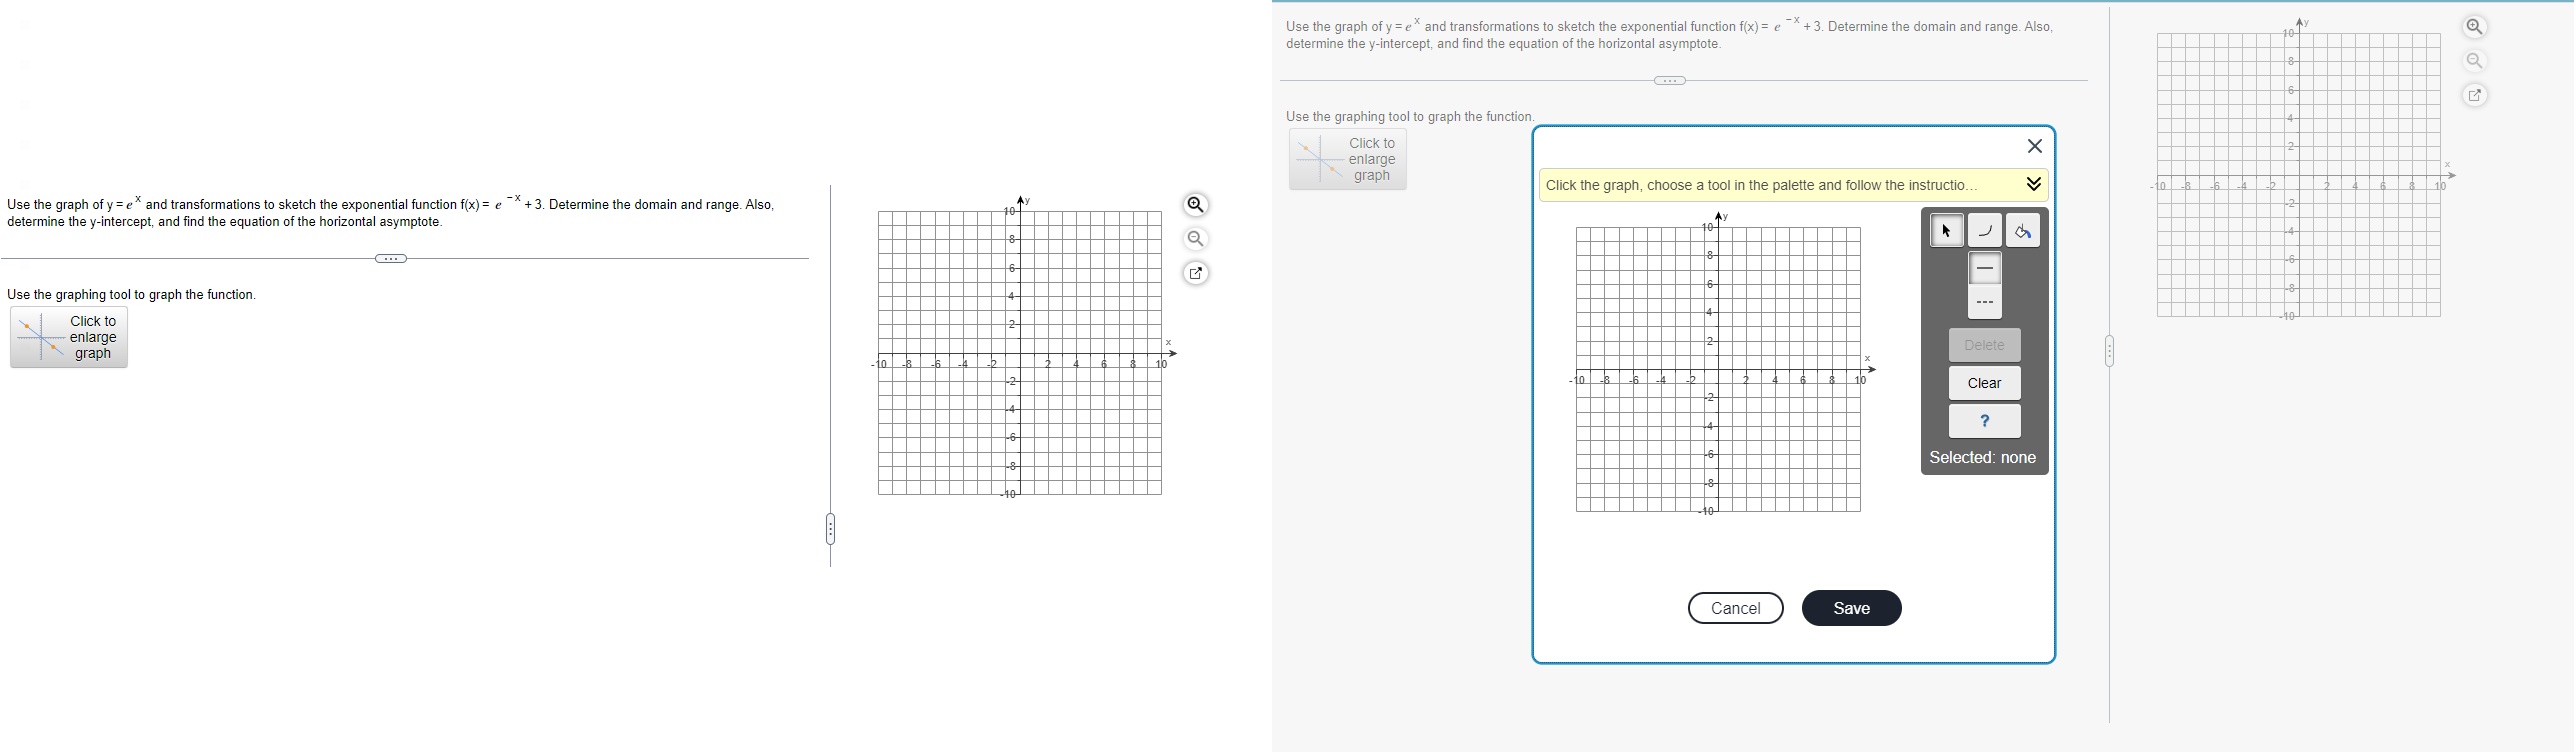
Use the graph of y = e* and transformations to sketch the exponential function f(x) = e - 1. Determine the domain and range. Also, determine the y-intercept, and find the equation of the horizontal asymptote. Use the graphing tool to graph the function. X Click to enlarge Use the graph of y = e" and transformations to sketch the exponential function f(x) = e - 1. Determine the domain and range. Also, graph Use the given interactions to edit the selected curve. determine the y-intercept, and find the equation of the horizontal asymptote. -6 Use the graphing tool to graph the function. Click to enlarge graph 10 -8 Delete Clear ? Vertical Stretch Horizontal Stretch Vertical Shift Horizontal Shift Cancel Save Reflection about x- Reflection about y- axis axisUse the graph of y = e" and transformations to sketch the exponential function f(x) = e + 3. Determine the domain and range. Also, determine the y-intercept, and find the equation of the horizontal asymptote. Use the graphing tool to graph the function. Click to X enlarge graph Click the graph, choose a tool in the palette and follow the instructio V Use the graph of y = e* and transformations to sketch the exponential function f(x) = e "*+ 3. Determine the domain and range. Also, determine the y-intercept, and find the equation of the horizontal asymptote. Use the graphing tool to graph the function. Click to enlarge graph 10 8 Clear ? Selected: none Cancel Save
Step by Step Solution
There are 3 Steps involved in it

Get step-by-step solutions from verified subject matter experts