

Question: Need help! thank you. QUESTION 8 ' 10poin|s SaveAnswer Sample data for the gross income for the last months was collected. Due to the non-linear
Need help! thank you.
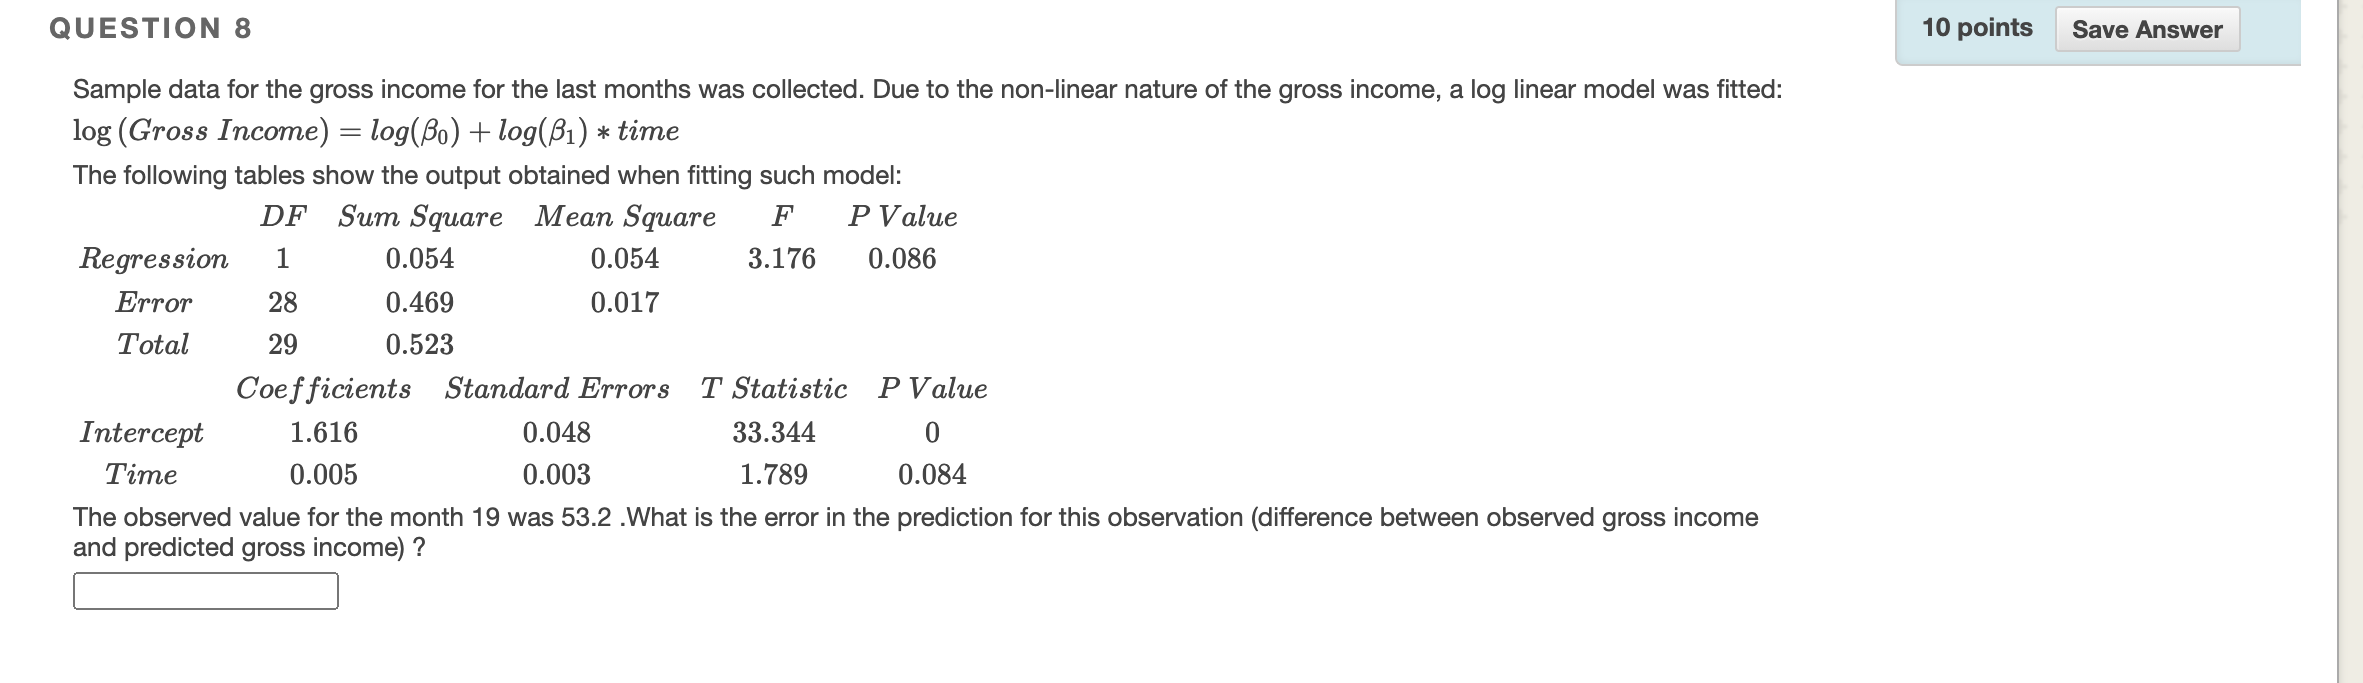
QUESTION 8 ' 10poin|s SaveAnswer Sample data for the gross income for the last months was collected. Due to the non-linear nature of the gross income, a log linear model was fitted: log (Gross Income) = log(o) + log(/31) 4: time The following tables show the output obtained when fitting such model: DF Sum Square Mean Square F P Value Regression 1 0.054 0.054 3.176 0.086 Error 28 0.469 0.017 Total 29 0.523 Coefficients Standard Errors T Statistic P Value Intercept 1.616 0.048 33.344 0 Time 0.005 0.003 1.789 0.084 The observed value for the month 19 was 53.2 .What is the error in the prediction for this observation (difference between observed gross income and predicted gross income)
Step by Step Solution
There are 3 Steps involved in it

Get step-by-step solutions from verified subject matter experts