

Question: need help thanks 5) (8 points) A real estate agent is interested in seeing whether the size of a house correlates with its sales price.
need help thanks
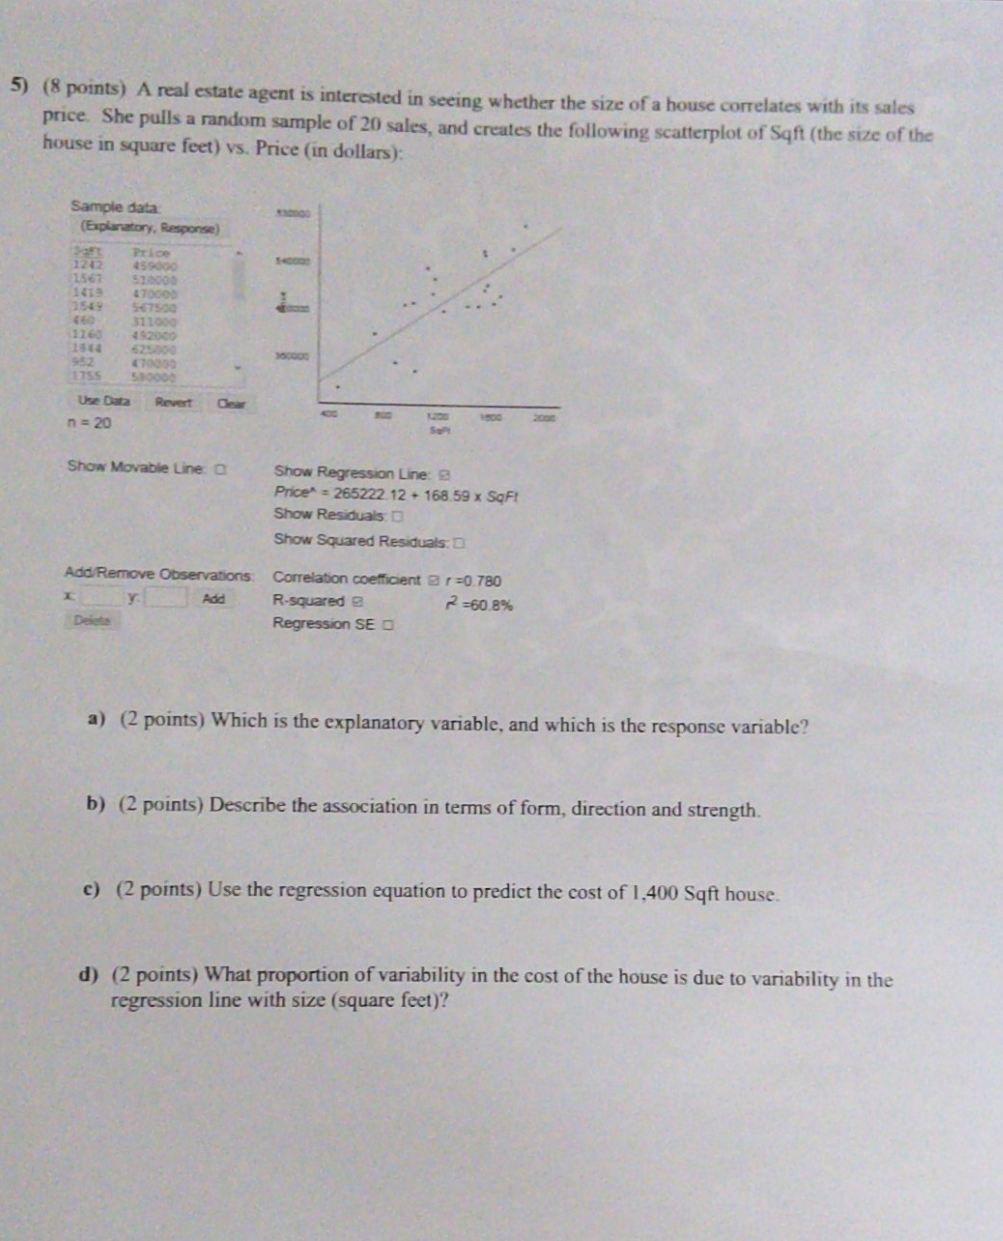
5) (8 points) A real estate agent is interested in seeing whether the size of a house correlates with its sales price. She pulls a random sample of 20 sales, and creates the following scatterplot of Sqft (the size of the house in square feet) vs. Price (in dollars): Sample data (Explanatory, Response) Price 124 459060 1567 526000 470008 7549 567500 460 311000 1760 492009 1544 625000 952 470050 580000 Use Data Revert Dear 1506 n = 20 Show Movable Line: 0 Show Regression Line: 3 Prices = 265222. 12 + 168.59 x SqFI Show Residuals: Show Squared Residuals.D Add/Remove Observations Correlation coefficient ar =0.780 Adid R-squared 2=60.8% Regression SE O a) (2 points) Which is the explanatory variable, and which is the response variable? b) (2 points) Describe the association in terms of form, direction and strength. c) (2 points) Use the regression equation to predict the cost of 1,400 Sqft house. d) (2 points) What proportion of variability in the cost of the house is due to variability in the regression line with size (square feet)
Step by Step Solution
There are 3 Steps involved in it

Get step-by-step solutions from verified subject matter experts