Question: Need help The figure below is from a paper published by Reimers and Dahn in the Journal of the Electrochemical Society 139, 2091 (1992). In

Need helpNeed help The figure below is from a paper

The figure below is from a paper published by Reimers and Dahn in the Journal of the Electrochemical Society 139, 2091 (1992). In this study, the two researchers measured how the lattice constants of LiCoO2, one of the most widely used cathode materials for lithium-ion rechargeable batteries, vary upon lithium insertion/extraction by using X-ray diffraction. Panel (c) of the figure shows the unit cell volume (each unit cell contains 3 Co and 6 O atoms) as a function of the lithium concentration x in Li,C002. LiCoO2 transforms between several phases (phase I, II and Mono.) upon Li extraction. Please draw on the figure and describe how you would graphically determine the partial molar volume of Li, Vli , in phase I at x = 0.9 and in phase II at x=0.9, respectively. Note: pay attention to the horizontal axis and think if the intercept rule can be used here. 2.82(a) Mono. I 000000epool II 2.81 orantmoon000000000000 2.80 Mono. 14.4 (b) ooned 14.3 II 14.2 14.1 0000000000 14.0 Mono. (c) 98.5 opeo 98.0 II Volume (8) 97.5 - 100000 000000000 $97.0 - 96.5 (a) 50- Temp. (C) II II I+II I Mono. 0.3 0.4 0.5 0.6 0.7 0.8 0.9 1.0 I in Li, C002 Fig. 11. Unit cell constants a (a), (b), and cell volume (c) as a function of lithium concentration x in Li CoOz. Combined with the electrochemical results, (a), (b), and (c) determine a global phase diagram (d) for Li, Cooz

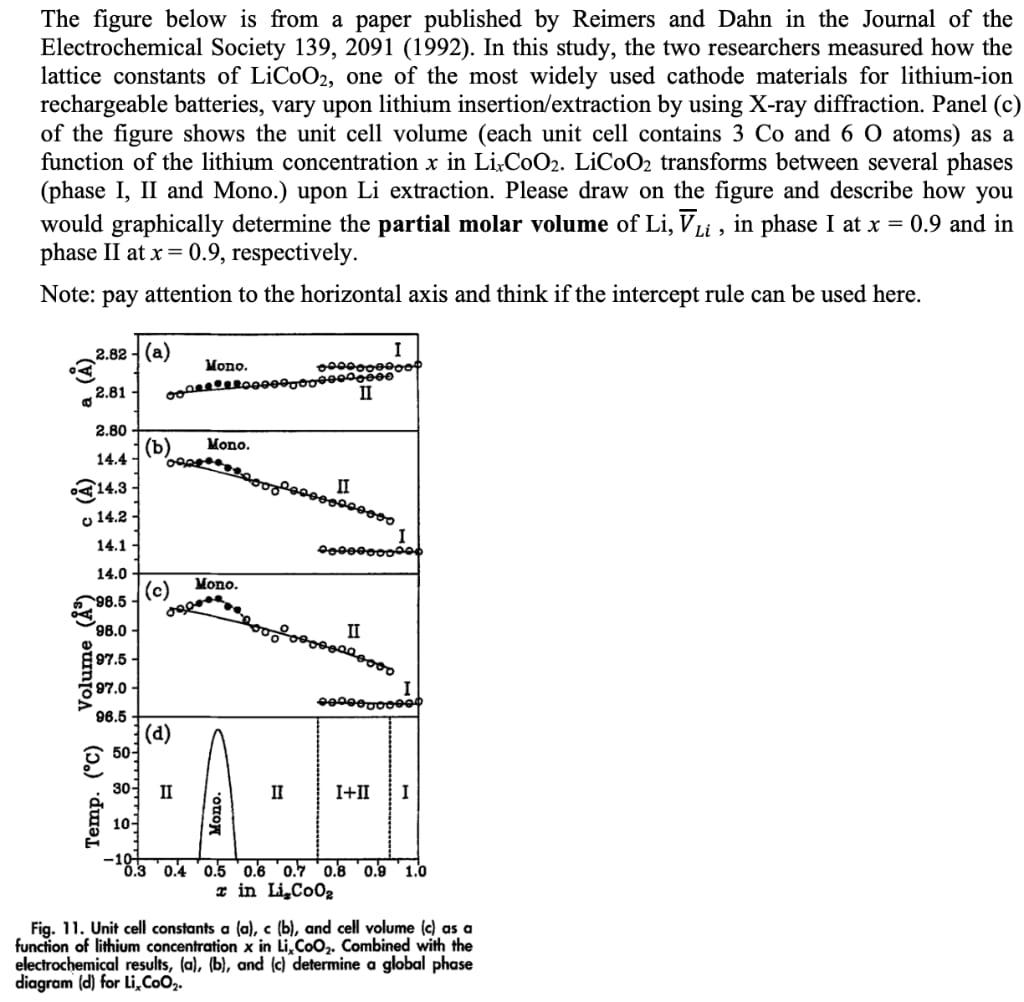
Step by Step Solution

There are 3 Steps involved in it

1 Expert Approved Answer
Step: 1 Unlock blur-text-image
Question Has Been Solved by an Expert!

Get step-by-step solutions from verified subject matter experts

Step: 2 Unlock
Step: 3 Unlock

Students Have Also Explored These Related General Management Questions!