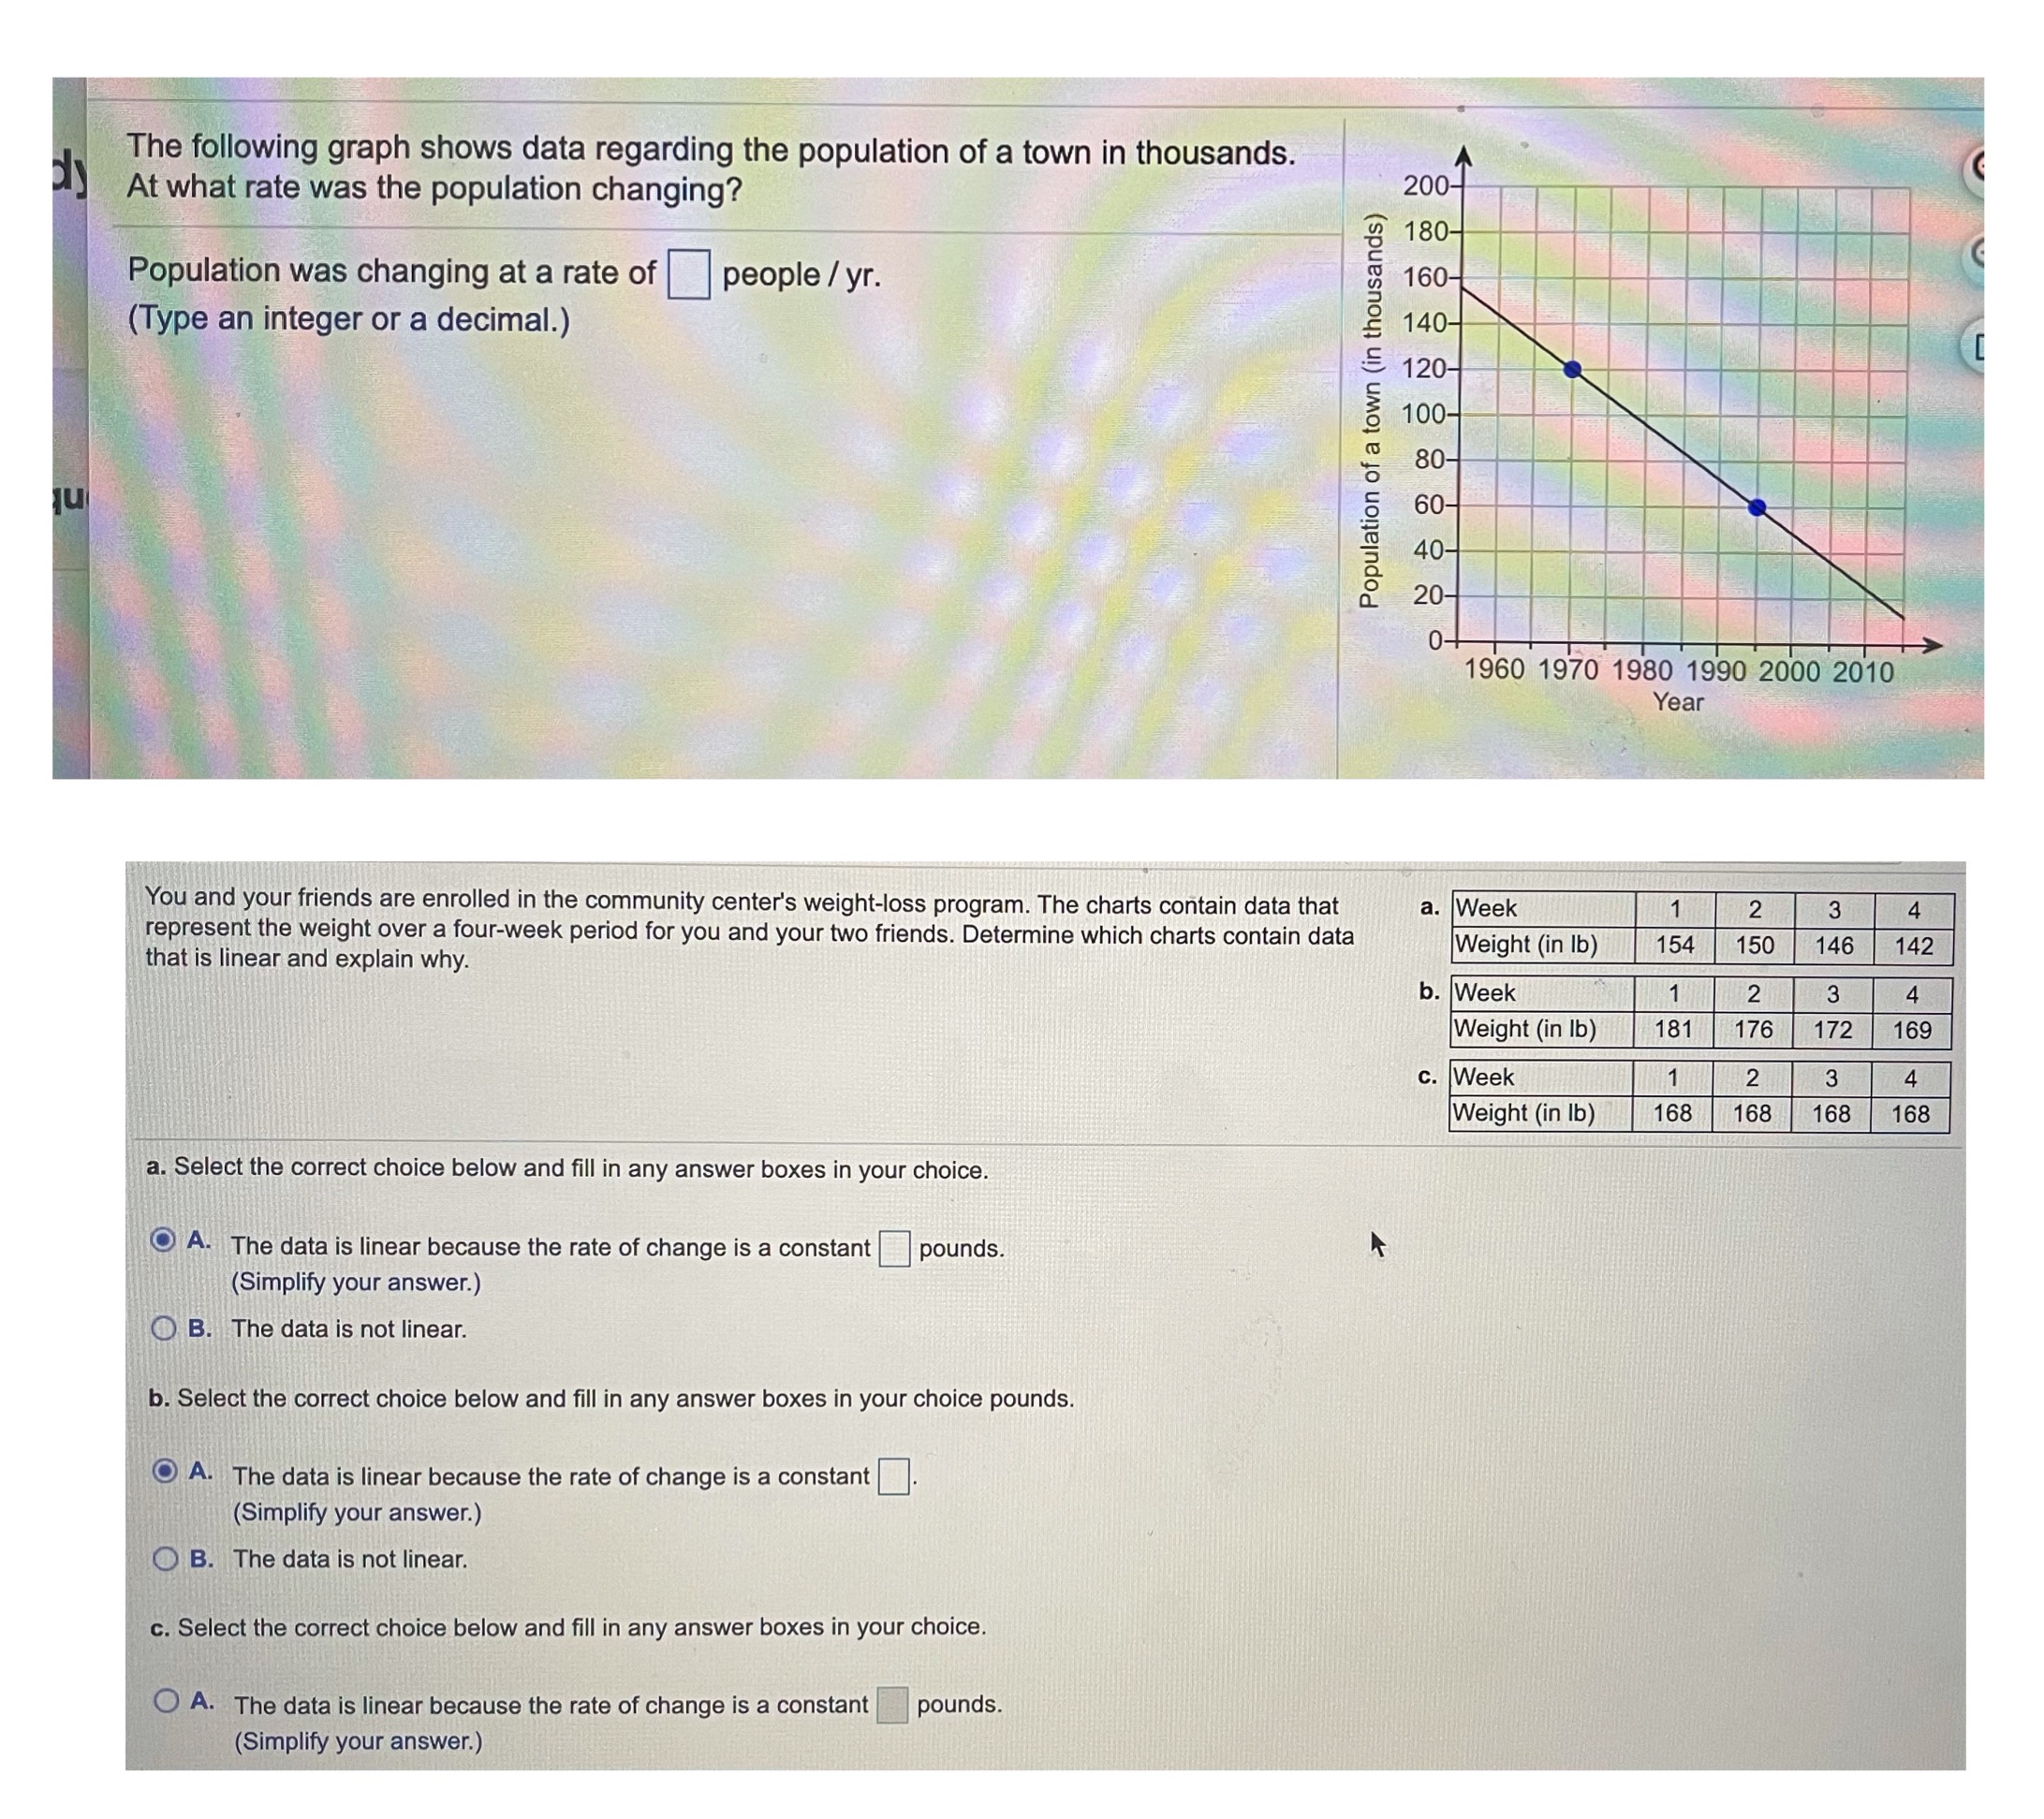
Question: Need help The following graph shows data regarding the population of a town in thousands. At what rate was the population changing? 200- 180- Population

Need help

Need help The following graph shows data
The following graph shows data regarding the population of a town in thousands. At what rate was the population changing? 200- 180- Population was changing at a rate of people / yr. 160- (Type an integer or a decimal.) 140- 120- Population of a town (in thousands) 100 - 80 - 60- 40- 20 - 1960 1970 1980 1990 2000 2010 Year You and your friends are enrolled in the community center's weight-loss program. The charts contain data that a. Week 2 3 4 represent the weight over a four-week period for you and your two friends. Determine which charts contain data Weight (in lb) 154 150 146 142 that is linear and explain why. b. Week 3 4 Weight (in lb) 181 176 172 169 Week 2 3 Weight (in lb) 168 168 a. Select the correct choice below and fill in any answer boxes in your choice. O A. The data is linear because the rate of change is a constant |pounds. Simplify your answer.) O B. The data is not linear. b. Select the correct choice below and fill in any answer boxes in your choice pounds. O A. The data is linear because the rate of change is a constant. Simplify your answer.) B. The data is not linear. c. Select the correct choice below and fill in any answer boxes in your choice. A. The data is linear because the rate of change is a constant pounds. Simplify your answer.)

Step by Step Solution

There are 3 Steps involved in it

1 Expert Approved Answer
Step: 1 Unlock blur-text-image
Question Has Been Solved by an Expert!

Get step-by-step solutions from verified subject matter experts

Step: 2 Unlock
Step: 3 Unlock

Students Have Also Explored These Related Mathematics Questions!