

Question: Need help to solve this depreciation (MACRS) problems. Thanks! 2. Blue Bayou, Inc., purchases the following assets during its 2017 tax year (the fiscal during
Need help to solve this depreciation (MACRS) problems. Thanks!
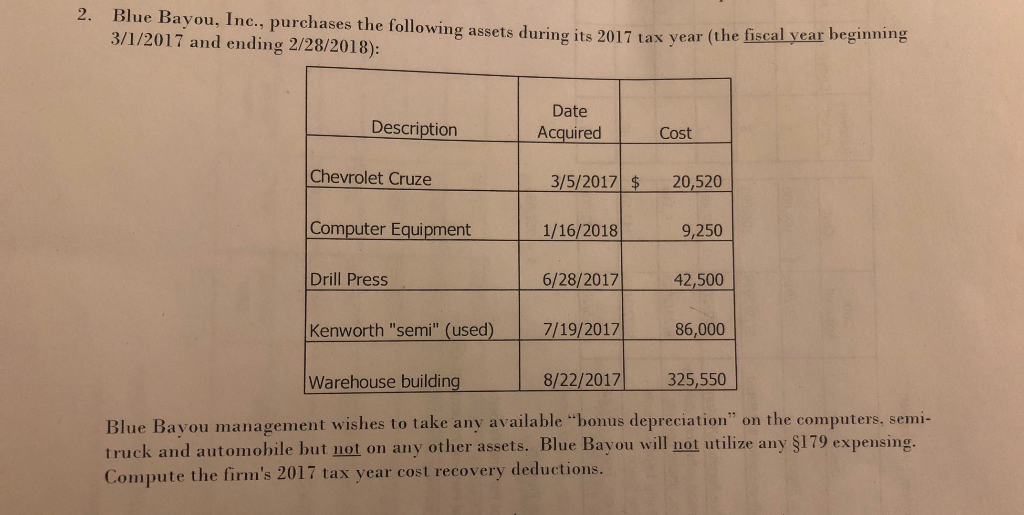
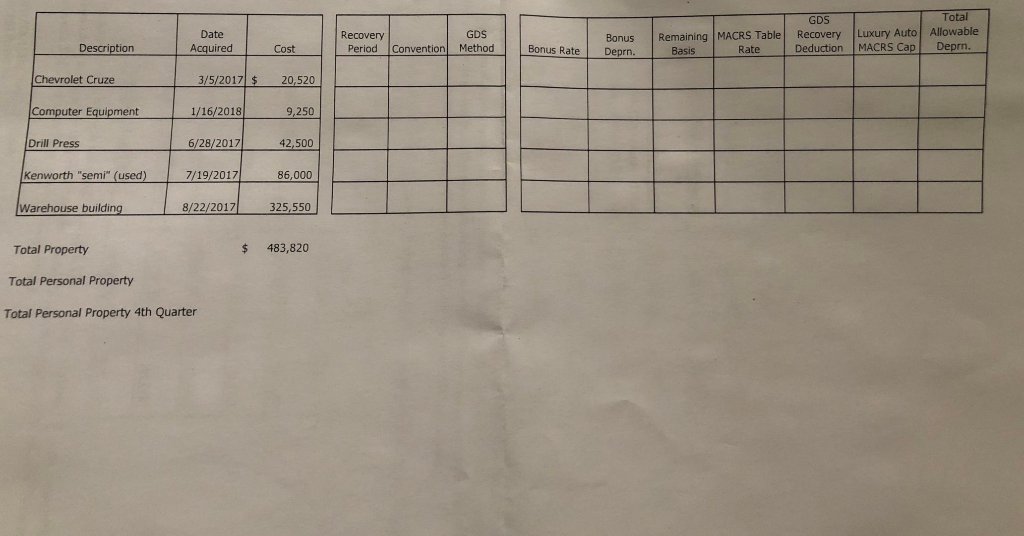
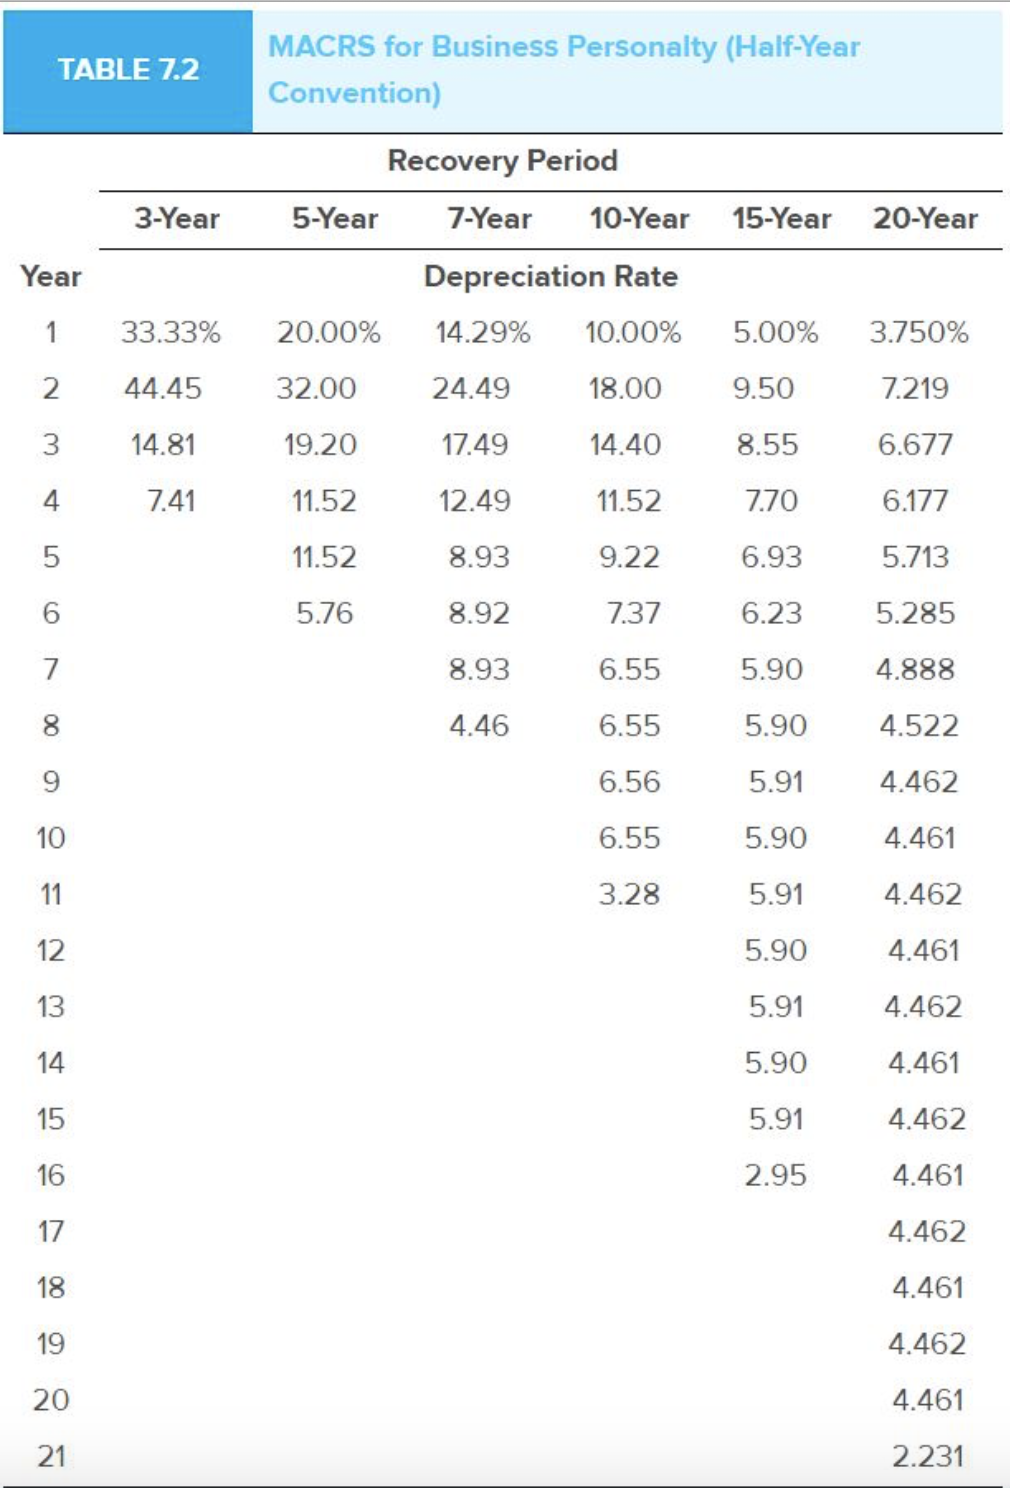
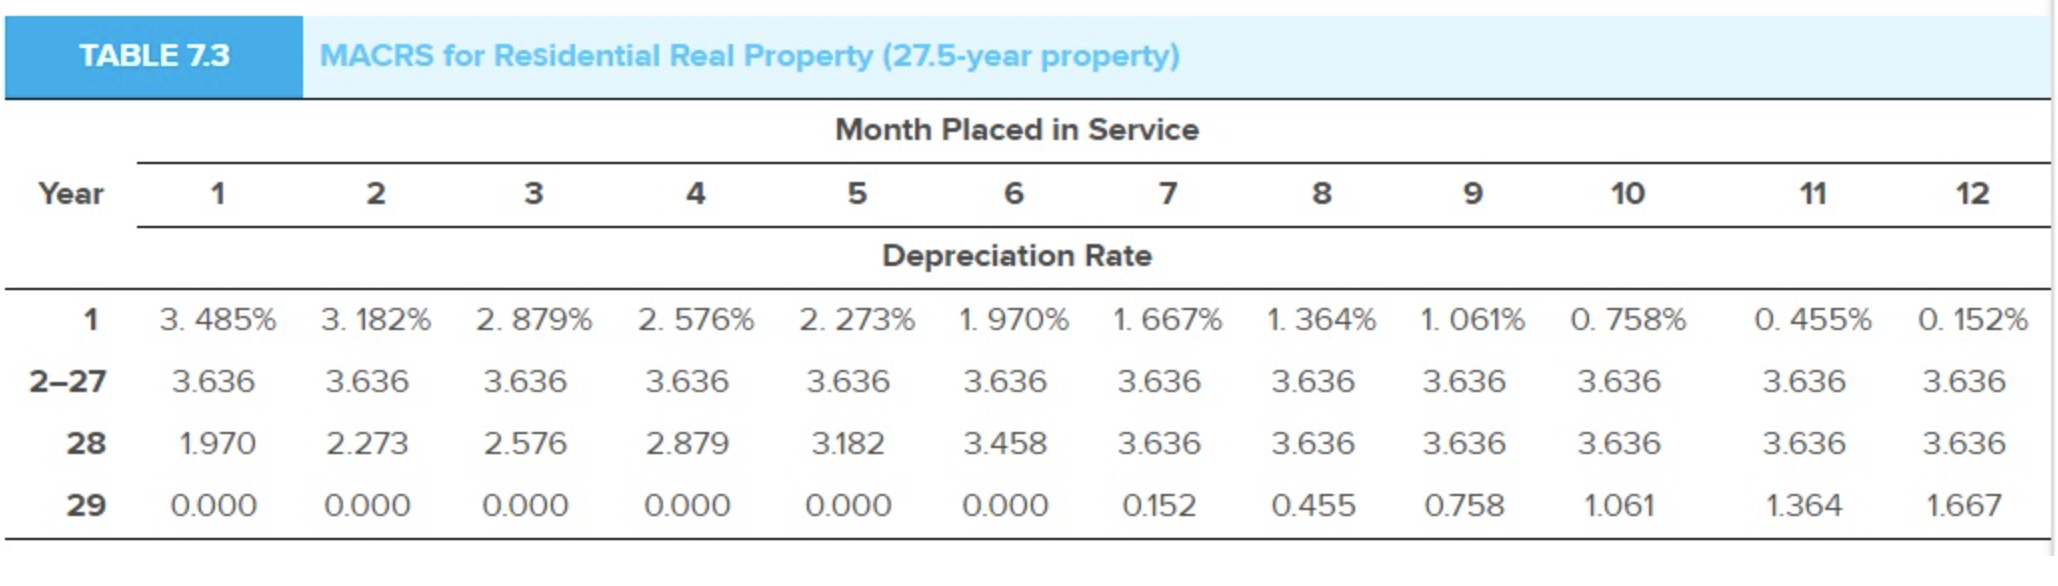
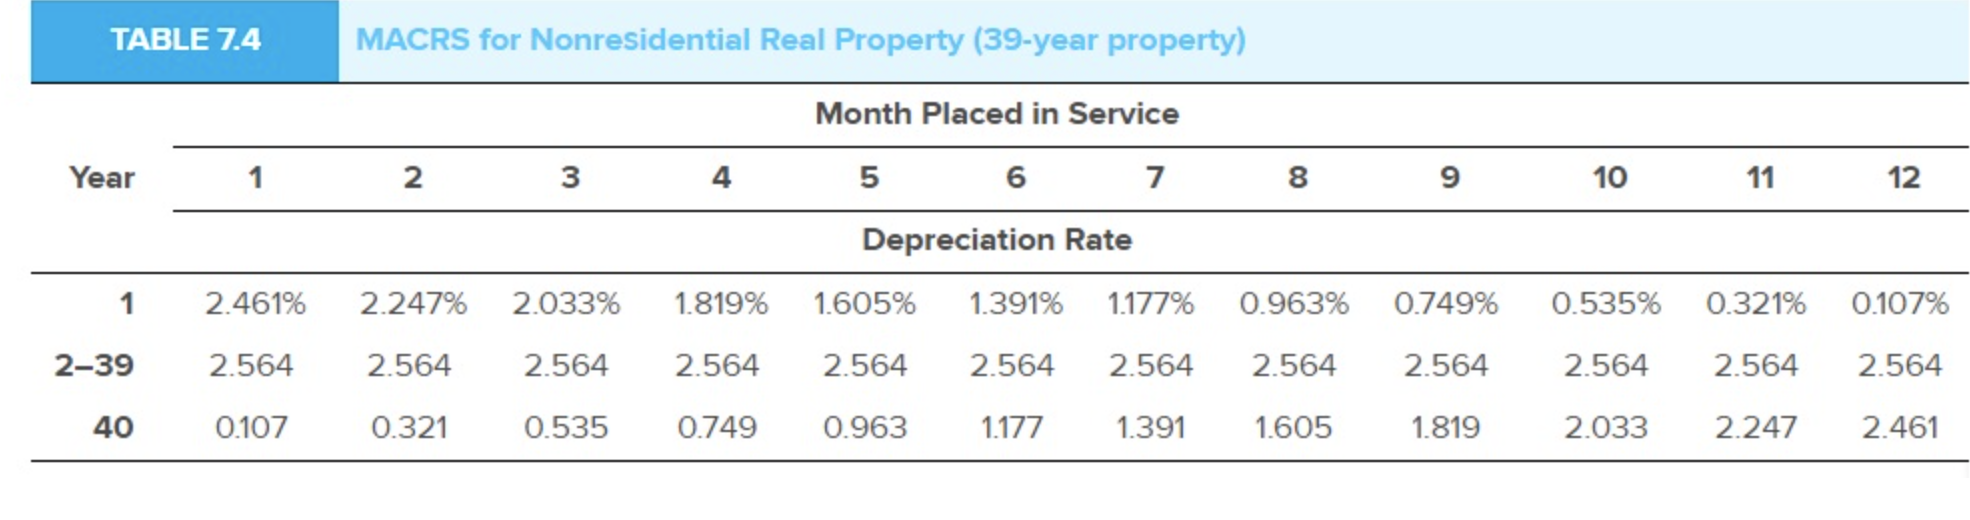
2. Blue Bayou, Inc., purchases the following assets during its 2017 tax year (the fiscal during its 2017 tax year (the fiscal year beginning 3/1/2017 and ending 2/28/2018): Description Date Acquired Cost Chevrolet Cruze 3/5/2017 $ 20,520 Computer Equipment 1/16/2018 9,250 Drill Press 6/28/2017 42,500 Kenworth "semi" (used) 7/19/2017 86,000 Warehouse building 8/22/2017 325,550 Blue Bavou management wishes to take any available "bonus depreciation on the computers, semi- truck and automobile but not on any other assets. Blue Bayou will not utilize any $179 expensing. Compute the firm's 2017 tax year cost recovery deductions. Total Date Acquired Recovery Period GDS Convention Method GDS Recovery Deduction Description Bonus Deprn. Luxury Auto MACRS Cap Remaining MACRS Table Basis Rate Allowable Deprn. Cost Bonus Rate Chevrolet Cruze 3/5/2017 $ 20,520 Computer Equipment 1/16/2018 9,250 Drill Press 6/28/2017| 42,500 Kenworth "semi" (used) 7/19/2017) 86,000 Warehouse building 8/22/2017| 325,550 Total Property $ 483,820 Total Personal Property Total Personal Property 4th Quarter TABLE 7.2 MACRS for Business Personalty (Half-Year Convention) 3-Year 15-Year 20-Year Year 1 2 Recovery Period 5-Year 7-Year 10-Year Depreciation Rate 20.00% 14.29% 10.00% 32.00 24.49 18.00 19.20 17.49 14.40 33.33% 44.45 14.81 5.00% 9.50 8.55 7.41 11.52 12.49 11.52 7.70 11.52 8.93 9.22 6.93 3.750% 7.219 6.677 6.177 5.713 5.285 4.888 4.522 4.462 4.461 5.76 8.92 6.23 8.93 5.90 7.37 6.55 6.55 6.56 4.46 5.90 5.91 6.55 5.90 3.28 4.462 4.461 5.91 5.90 5.91 5.90 5.91 4.462 4.461 4.462 4.461 2.95 4.462 4.461 4.462 4.461 2.231 TABLE 7.3 MACRS for Residential Real Property (27.5-year property) Month Placed in Service 5 6 7 Year 1 2 3 4 8 9 10 11 12 ciation Rate 1 2-27 28 29 3.485% 3.636 1.970 0.000 3.182% 3.636 2.273 0.000 2.879% 2.576% 3.6363.636 2.5762.879 0.000 0.000 2.273% 3.636 3.182 0.000 1.970% 3.636 3.458 0.000 1.667% 3.636 3.636 0.152 1.364% 3.636 3.636 0.455 1.061% 3.636 3.636 0.758 0.758% 3.636 3.636 1.061 3 3 0.455% .636 .636 1.364 0.152% 3.636 3.636 1.667 TABLE 7.4 MACRS for Nonresidential Real Property (39-year property) Year 1 2 3 8 9 10 11 12 Month Placed in Service 4 5 6 7 Depreciation Rate 1.819% 1.605% 1.391% 1177% 2.564 2.564 2.564 2.564 0.7490.963 1.177 1.391 2-39 40 2.461% 2.564 0.107 2.247% 2.564 0.321 2.033% 2.564 0.535 0.963% 2.564 1.605 0.749% 2.564 1.819 0.535% 2.564 2.033 0.321% 2.564 2.247 0.107% 2.564 2.461 2. Blue Bayou, Inc., purchases the following assets during its 2017 tax year (the fiscal during its 2017 tax year (the fiscal year beginning 3/1/2017 and ending 2/28/2018): Description Date Acquired Cost Chevrolet Cruze 3/5/2017 $ 20,520 Computer Equipment 1/16/2018 9,250 Drill Press 6/28/2017 42,500 Kenworth "semi" (used) 7/19/2017 86,000 Warehouse building 8/22/2017 325,550 Blue Bavou management wishes to take any available "bonus depreciation on the computers, semi- truck and automobile but not on any other assets. Blue Bayou will not utilize any $179 expensing. Compute the firm's 2017 tax year cost recovery deductions. Total Date Acquired Recovery Period GDS Convention Method GDS Recovery Deduction Description Bonus Deprn. Luxury Auto MACRS Cap Remaining MACRS Table Basis Rate Allowable Deprn. Cost Bonus Rate Chevrolet Cruze 3/5/2017 $ 20,520 Computer Equipment 1/16/2018 9,250 Drill Press 6/28/2017| 42,500 Kenworth "semi" (used) 7/19/2017) 86,000 Warehouse building 8/22/2017| 325,550 Total Property $ 483,820 Total Personal Property Total Personal Property 4th Quarter TABLE 7.2 MACRS for Business Personalty (Half-Year Convention) 3-Year 15-Year 20-Year Year 1 2 Recovery Period 5-Year 7-Year 10-Year Depreciation Rate 20.00% 14.29% 10.00% 32.00 24.49 18.00 19.20 17.49 14.40 33.33% 44.45 14.81 5.00% 9.50 8.55 7.41 11.52 12.49 11.52 7.70 11.52 8.93 9.22 6.93 3.750% 7.219 6.677 6.177 5.713 5.285 4.888 4.522 4.462 4.461 5.76 8.92 6.23 8.93 5.90 7.37 6.55 6.55 6.56 4.46 5.90 5.91 6.55 5.90 3.28 4.462 4.461 5.91 5.90 5.91 5.90 5.91 4.462 4.461 4.462 4.461 2.95 4.462 4.461 4.462 4.461 2.231 TABLE 7.3 MACRS for Residential Real Property (27.5-year property) Month Placed in Service 5 6 7 Year 1 2 3 4 8 9 10 11 12 ciation Rate 1 2-27 28 29 3.485% 3.636 1.970 0.000 3.182% 3.636 2.273 0.000 2.879% 2.576% 3.6363.636 2.5762.879 0.000 0.000 2.273% 3.636 3.182 0.000 1.970% 3.636 3.458 0.000 1.667% 3.636 3.636 0.152 1.364% 3.636 3.636 0.455 1.061% 3.636 3.636 0.758 0.758% 3.636 3.636 1.061 3 3 0.455% .636 .636 1.364 0.152% 3.636 3.636 1.667 TABLE 7.4 MACRS for Nonresidential Real Property (39-year property) Year 1 2 3 8 9 10 11 12 Month Placed in Service 4 5 6 7 Depreciation Rate 1.819% 1.605% 1.391% 1177% 2.564 2.564 2.564 2.564 0.7490.963 1.177 1.391 2-39 40 2.461% 2.564 0.107 2.247% 2.564 0.321 2.033% 2.564 0.535 0.963% 2.564 1.605 0.749% 2.564 1.819 0.535% 2.564 2.033 0.321% 2.564 2.247 0.107% 2.564 2.461
Step by Step Solution
There are 3 Steps involved in it

Get step-by-step solutions from verified subject matter experts