

Question: Need help understanding assignment, its been years since i have done any of this and have no idea what to do. Please help, just looking
Need help understanding assignment, its been years since i have done any of this and have no idea what to do. Please help, just looking for guidance. Even links that i can try a descriptive statistics analyses with Excel
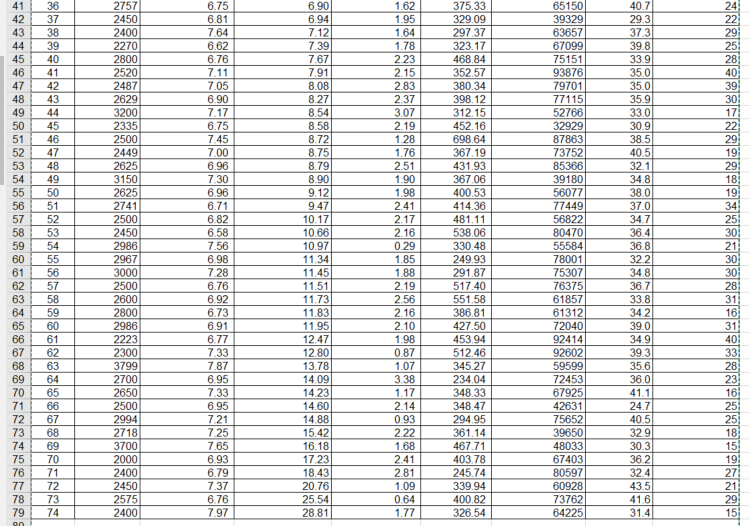
- Insert a new column in the database that corresponds to "Annual Sales." Annual Sales is the result of multiplying a restaurant's "SqFt." by "Sales/SqFt."
- Calculate the mean, standard deviation, skew, 5-number summary, and interquartile range (IQR) for each of the variables.
- make a box-plot for the "Annual Sales" variable.
- make a histogram for the "Sales/SqFt" variable.
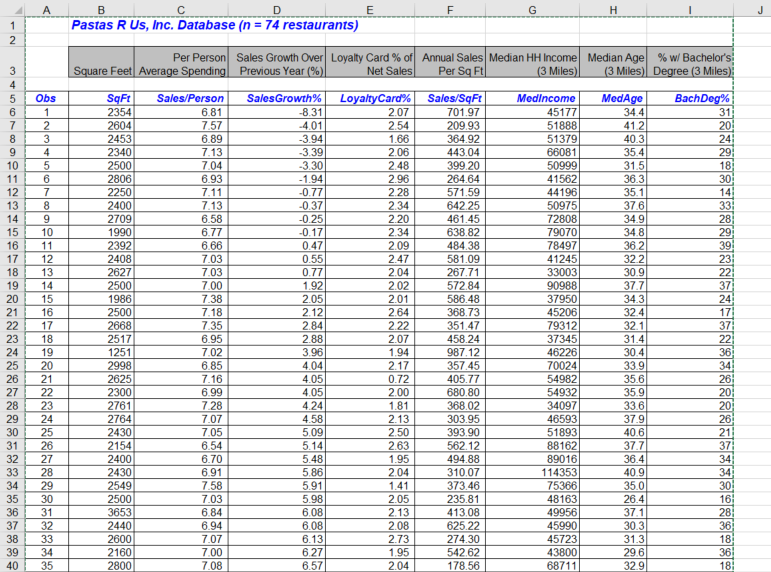
A B C D Pastas R Us, Inc. Database (n = 74 restaurants) E F G H Per Person Square Feet| Average Spending Sales Growth Over | Loyalty Card % of | Annual Sales Median HH Income Previous Year (%) Net Sales Per Sq Ft Median Age (3 Miles) % w/ Bachelor's (3 Miles)| Degree (3 Miles) SqFt Sales/Person SalesGrowth% 2354 LoyaltyCard% Sales/SqFt 6.81 Medincome MedAge 701.97 BachDog% 2604 4.01 45177 2453 2.54 51888 31 41.2 2340 -3.94 7.13 1.66 364.92 201 2500 -3.39 51379 2.06 241 66081 2806 -3.30 2.48 50999 29 6.93 399.20 -1.94 2.96 18 2250 264.64 31.5 2400 7.11 41562 7.13 2.28 30 -0.37 44196 2709 2.34 642.25 35.1 6.58 50975 14 10 1990 -0.25 37.6 33: 6.77 461.45 2.34 72808 28 11 0.17 2392 638.82 79070 12 2408 0.47 7.03 2.09 484.38 0.55 2.47 78497 13 581.09 41245 32 2 23 14 2627 7.03 0.77 2500 2.04 7.00 267.71 33003 30.9 15 1986 2.02 572.84 90988 22 16 7.38 2.05 2500 2.01 586.48 37 22 7.18 37950 17 2668 2.12 7.35 2.64 368,73 24 17 23 2517 2.22 45206 18 2.84 6.95 351.47 32.4 79312 32.1 37 24 19 2.07 458.24 37345 22 25 1251 7.02 20 1.94 2998 6.85 987.12 46226 36 26 21 2625 27 7.16 2.17 4.05 70024 0.72 405.77 33.9 22 2300 6.99 54982 34 28 23 4.05 35.6 2761 7.28 2.00 54932 26 1.81 368.02 35.9 20 29 24 2764 34097 20 30 25 7.07 2430 7.05 2.13 46593 31 26 5.09 2154 2.50 393,90 26 32 27 6.54 2400 5.14 51893 2.63 562.12 88162 21 37.7 37 33 6.70 28 5.48 2430 494.88 39016 34 29 2549 5.86 34 7.58 2.04 114353 40.9 35 30 2500 1.41 373.46 34 75366 35.0 31 3653 6.84 2.05 235.81 6.08 48163 30 37 32 2440 2.13 413.08 26.4 49956 16 38 33 2600 6.08 2.08 625.22 28 6.13 45990 2.73 274.30 30.3 45723 36 39 34 2160 18 35 2800 6.27 6.57 43800 2.04 178.56 29.6 68711 32 9 36 18\f
Step by Step Solution
There are 3 Steps involved in it

Get step-by-step solutions from verified subject matter experts