

Question: need help understanding problem and solving questions. Thanks 7. (Lesson 3-9: Linear Curve Fitting) The table displays the average annual salaries of Major League baseball
need help understanding problem and solving questions. Thanks
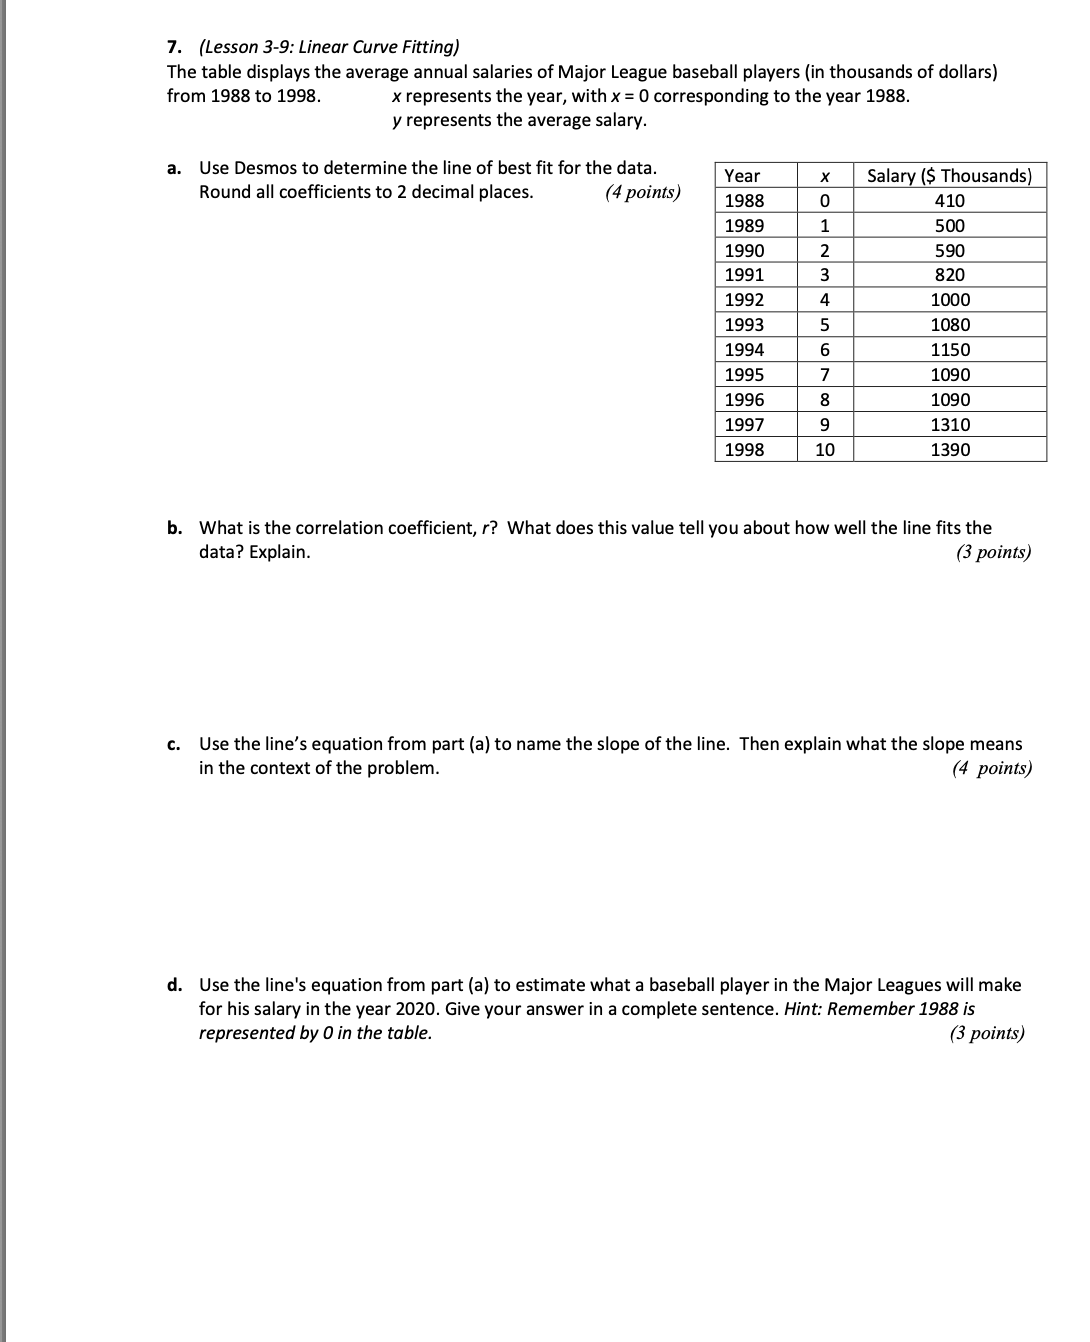
7. (Lesson 3-9: Linear Curve Fitting) The table displays the average annual salaries of Major League baseball players (in thousands of dollars) from 1988 to 1998. x represents the year, with x = 0 corresponding to the year 1988. y represents the average salary. a. Use Desmos to determine the line of best fit for the data. Round all coefficients to 2 decimal places. (4 points) Year X Salary ($ Thousands) 1988 0 410 1989 500 1990 1991 AWN 590 320 1992 1000 199 080 1994 150 1995 1090 1996 1090 1997 9 1310 1998 10 1390 b. What is the correlation coefficient, r? What does this value tell you about how well the line fits the data? Explain. (3 points) Use the line's equation from part (a) to name the slope of the line. Then explain what the slope means in the context of the problem. (4 points) d. Use the line's equation from part (a) to estimate what a baseball player in the Major Leagues will make for his salary in the year 2020. Give your answer in a complete sentence. Hint: Remember 1988 is represented by 0 in the table. (3 points)
Step by Step Solution
There are 3 Steps involved in it

Get step-by-step solutions from verified subject matter experts