

Question: Need help w/ questions 29 & 30 E h G easternflorida.instructure.com C CH 7-9 Exam: 202020-PHC-4094-40T-21307-1... HW 3 - Producing Data Flashcards | Quizlet myEFSC
Need help w/ questions 29 & 30
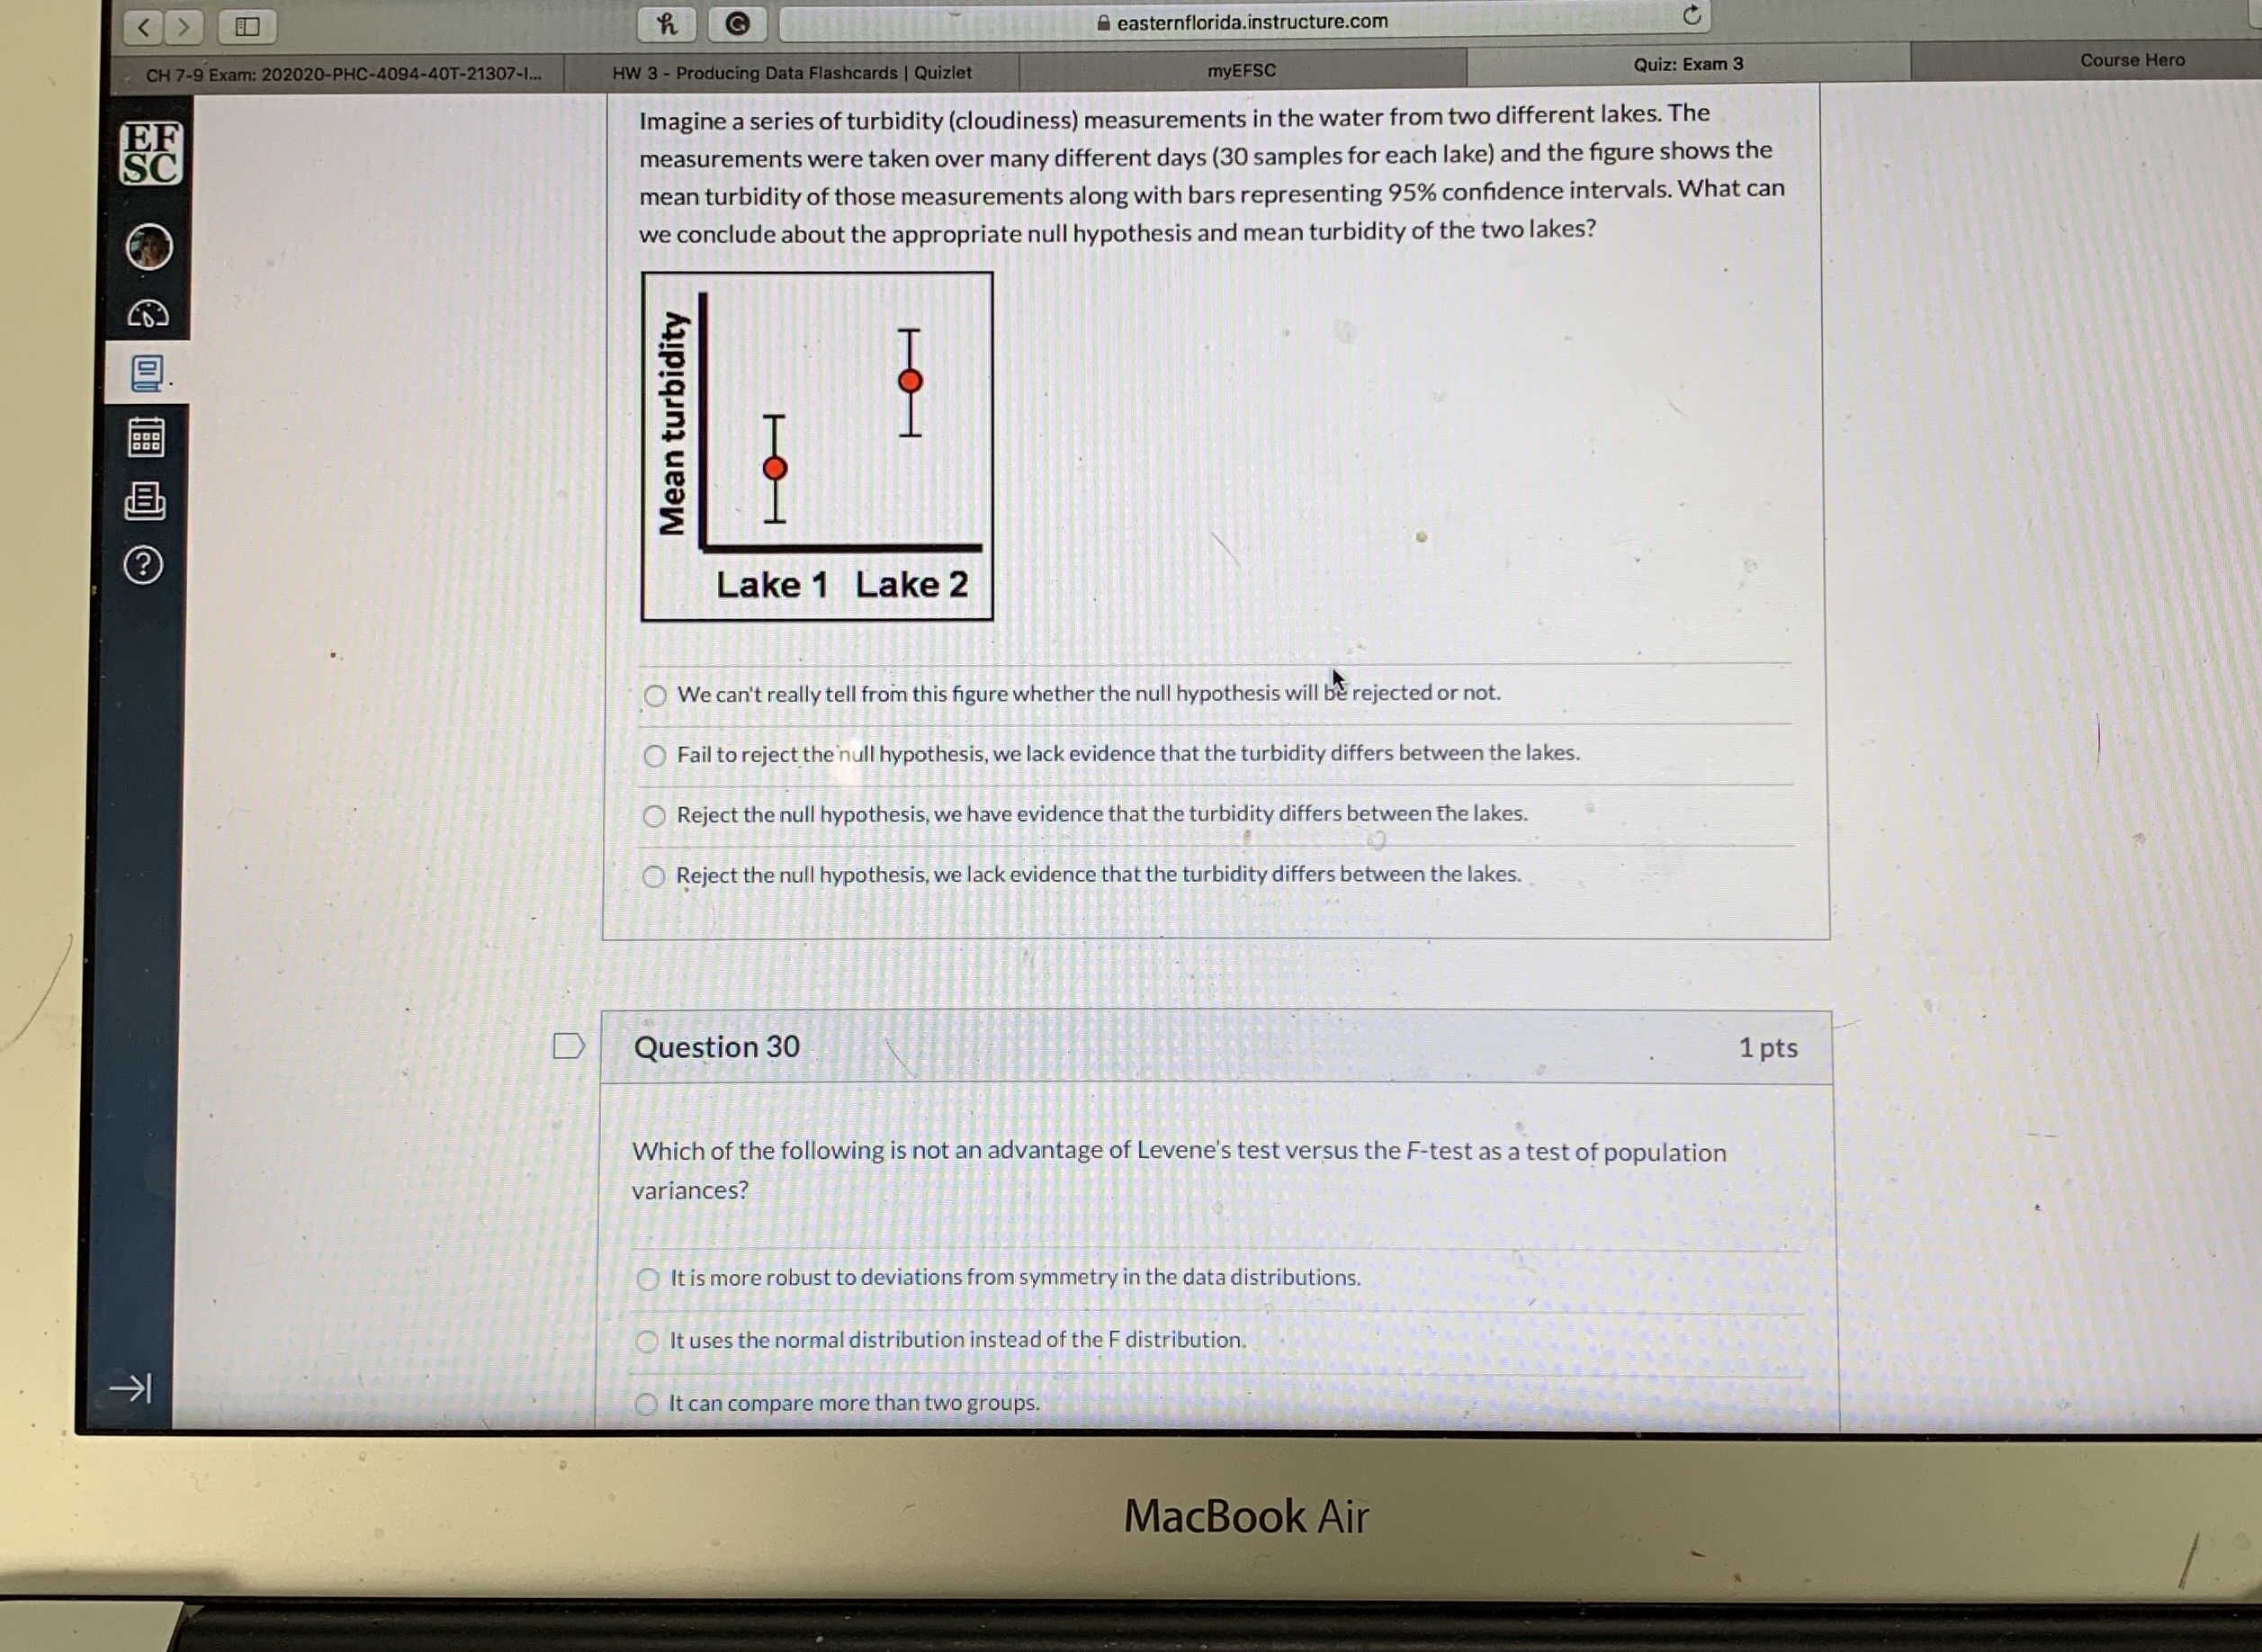
E h G easternflorida.instructure.com C CH 7-9 Exam: 202020-PHC-4094-40T-21307-1... HW 3 - Producing Data Flashcards | Quizlet myEFSC Quiz: Exam 3 Course Hero EF Imagine a series of turbidity (cloudiness) measurements in the water from two different lakes. The measurements were taken over many different days (30 samples for each lake) and the figure shows the mean turbidity of those measurements along with bars representing 95% confidence intervals. What can we conclude about the appropriate null hypothesis and mean turbidity of the two lakes? Mean turbidity ? Lake 1 Lake 2 We can't really tell from this figure whether the null hypothesis will be rejected or not. Fail to reject the null hypothesis, we lack evidence that the turbidity differs between the lakes. Reject the null hypothesis, we have evidence that the turbidity differs between the lakes. Reject the null hypothesis, we lack evidence that the turbidity differs between the lakes. D Question 30 1 pts Which of the following is not an advantage of Levene's test versus the F-test as a test of population variances? It is more robust to deviations from symmetry in the data distributions. It uses the normal distribution instead of the F distribution. K It can compare more than two groups. MacBook Air
Step by Step Solution
There are 3 Steps involved in it

Get step-by-step solutions from verified subject matter experts