

Question: need help with 4 Quarter Winter Spring Summer Fall Year 2016 73,000 104.000 168.000 74,000 Year 2017 65.000 82,000 124,000 52,000 Year 2018 89.000 146,000
need help with 4 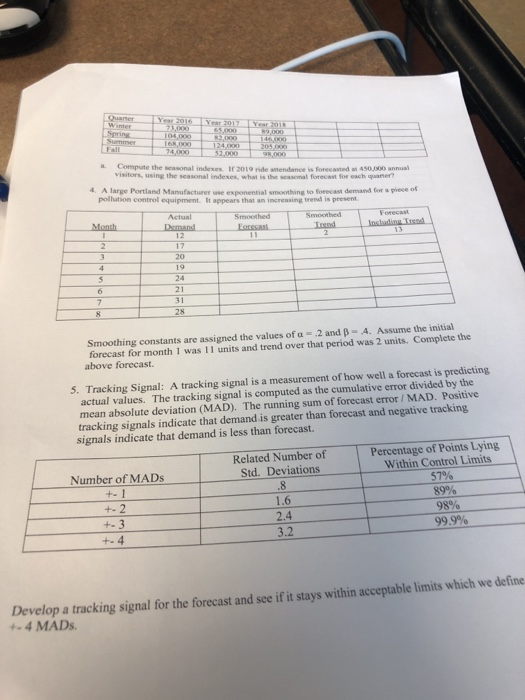
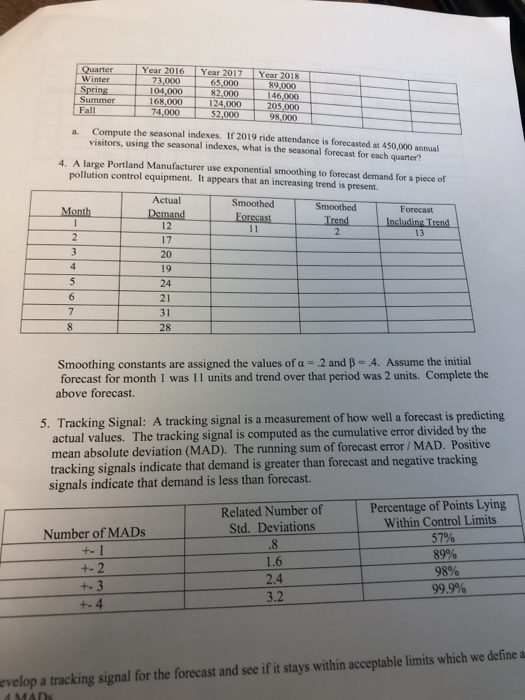
Quarter Winter Spring Summer Fall Year 2016 73,000 104.000 168.000 74,000 Year 2017 65.000 82,000 124,000 52,000 Year 2018 89.000 146,000 205,000 98,000 Compute the seasonal indexes. If 2019 ride attendance is forecasted at 450.000 annual visitors, using the seasonal indexes, what is the seasonal forecast for each quarter 4. A large Portland Manufacturer use exponential smoothing to forecast demand for a piece of pollution control equipment. It appears that an increasing trend is present Actual Smoothed Smoothed Fores Month Demand Forecast Trend Including Trend 12 112 17 20 2 3 5 6 7 8 24 21 31 28 Smoothing constants are assigned the values of a 2 and B = 4. Assume the initial forecast for month 1 was 11 units and trend over that period was 2 units. Complete the above forecast. 5. Tracking Signal: A tracking signal is a measurement of how well a forecast is predicting actual values. The tracking signal is computed as the cumulative error divided by the mean absolute deviation (MAD). The running sum of forecast error / MAD. Positive tracking signals indicate that demand is greater than forecast and negative tracking signals indicate that demand is less than forecast. Number of MADs - tol +- 2 Related Number of Std. Deviations .8 1.6 2.4 3.2 Percentage of Points Lying Within Control Limits 57% 89% 98% 99.9% +-4 evelop a tracking signal for the forecast and see if it stays within acceptable limits which we define a AMAD Yee 740 A large Portland Map s Smoothed Demand Instein Smoothing constants are assigned the values of a 2 and B - . Assume the initial forecast for month I was 11 units and trend over that period was 2 units. Complete the above forecast. 5. Tracking Signal: A tracking signal is a measurement of how well a forecast is predicting actual values. The tracking signal is computed as the cumulative error divided by the mean absolute deviation (MAD). The running sum of forecast error / MAD. Positive tracking signals indicate that demand is greater than forecast and negative tracking signals indicate that demand is less than forecast. Number of MADS Related Number of Std. Deviations Percentage of Points Lying Within Control Limits 57% 89% 98% L 99.9% + 2 1.6 2.4 3.2 Develop a tracking signal for the forecast and see if it stays within acceptable limits which we define - 4 MADs
Step by Step Solution
There are 3 Steps involved in it
1 Expert Approved Answer
Step: 1 Unlock

Question Has Been Solved by an Expert!
Get step-by-step solutions from verified subject matter experts
Step: 2 Unlock
Step: 3 Unlock