

Question: Need help with 5-16. Question 5 2 pts Here is a graph of the hypothesis test in this set of questions. There are 10 questions
Need help with 5-16.
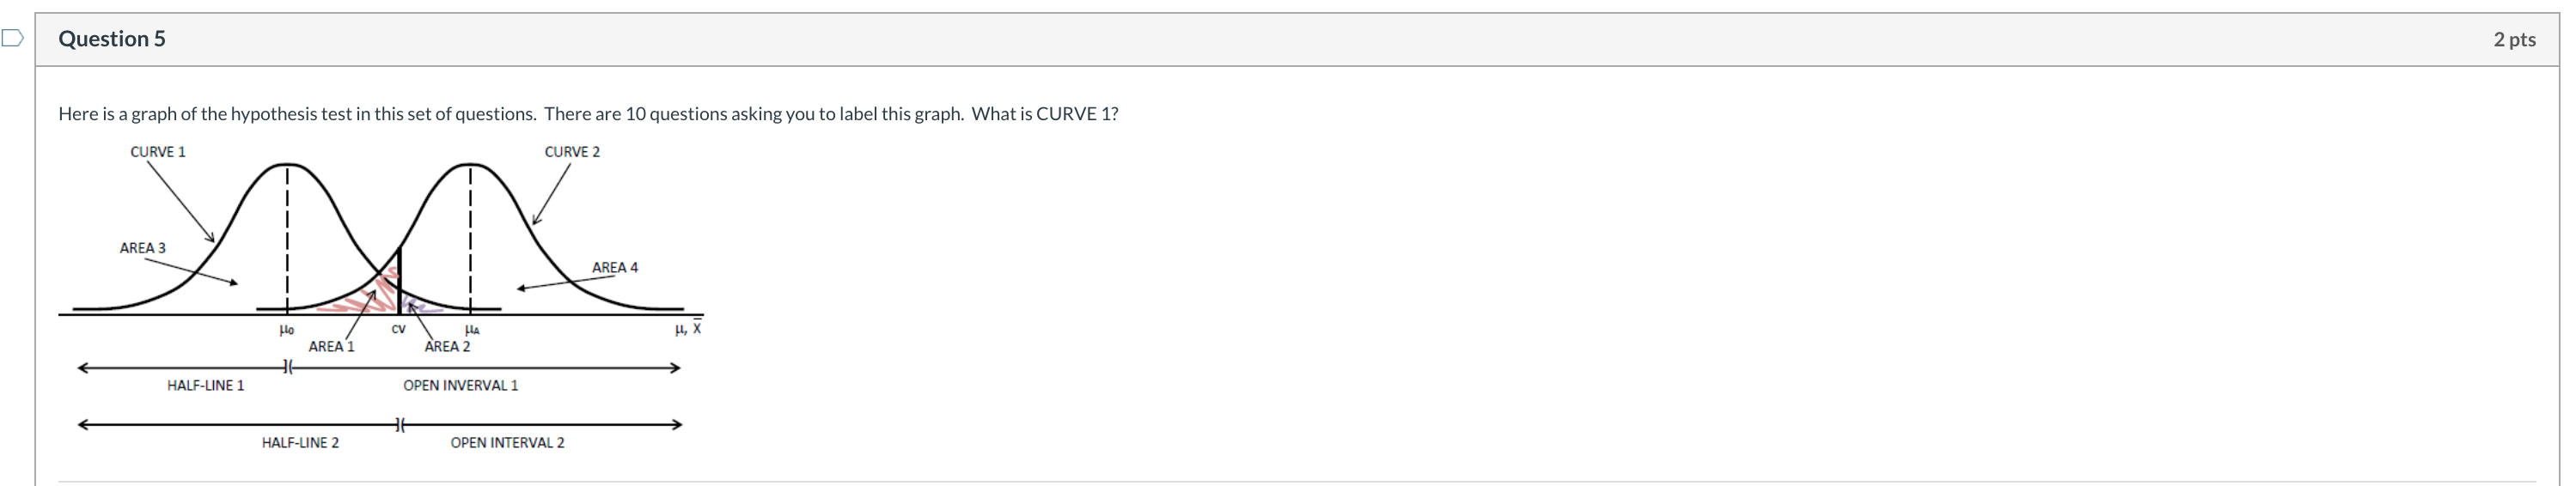
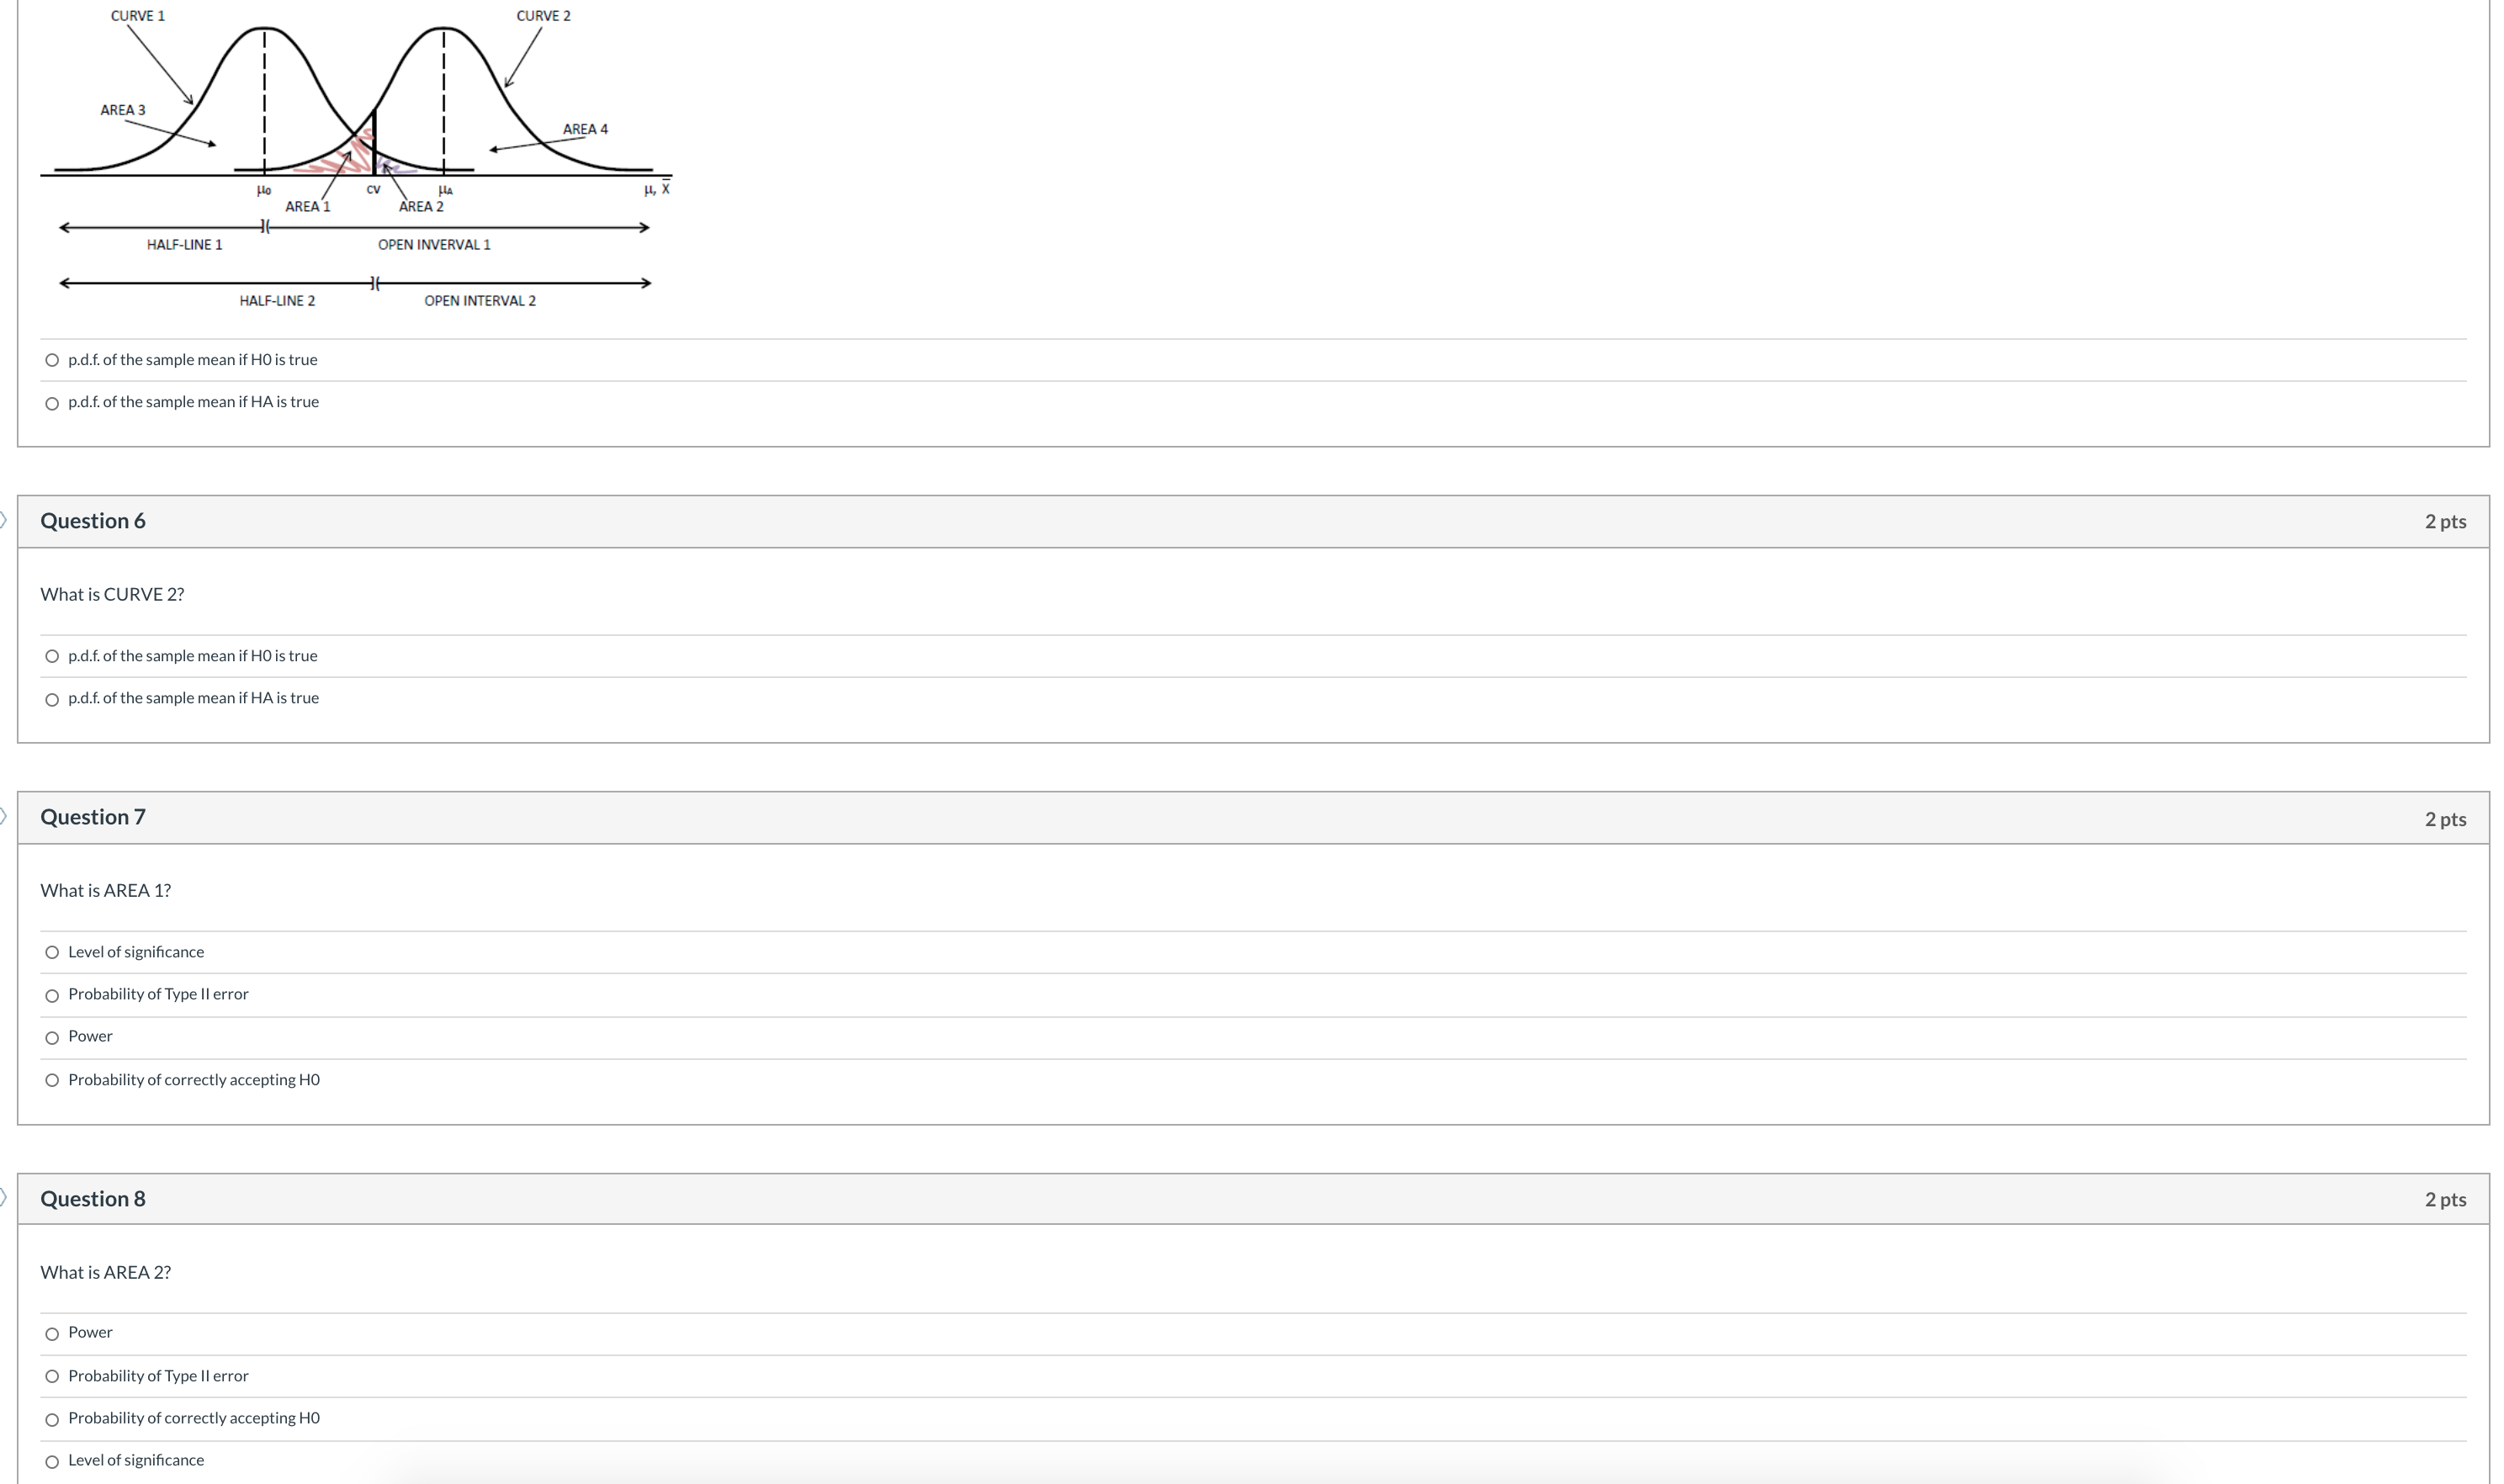
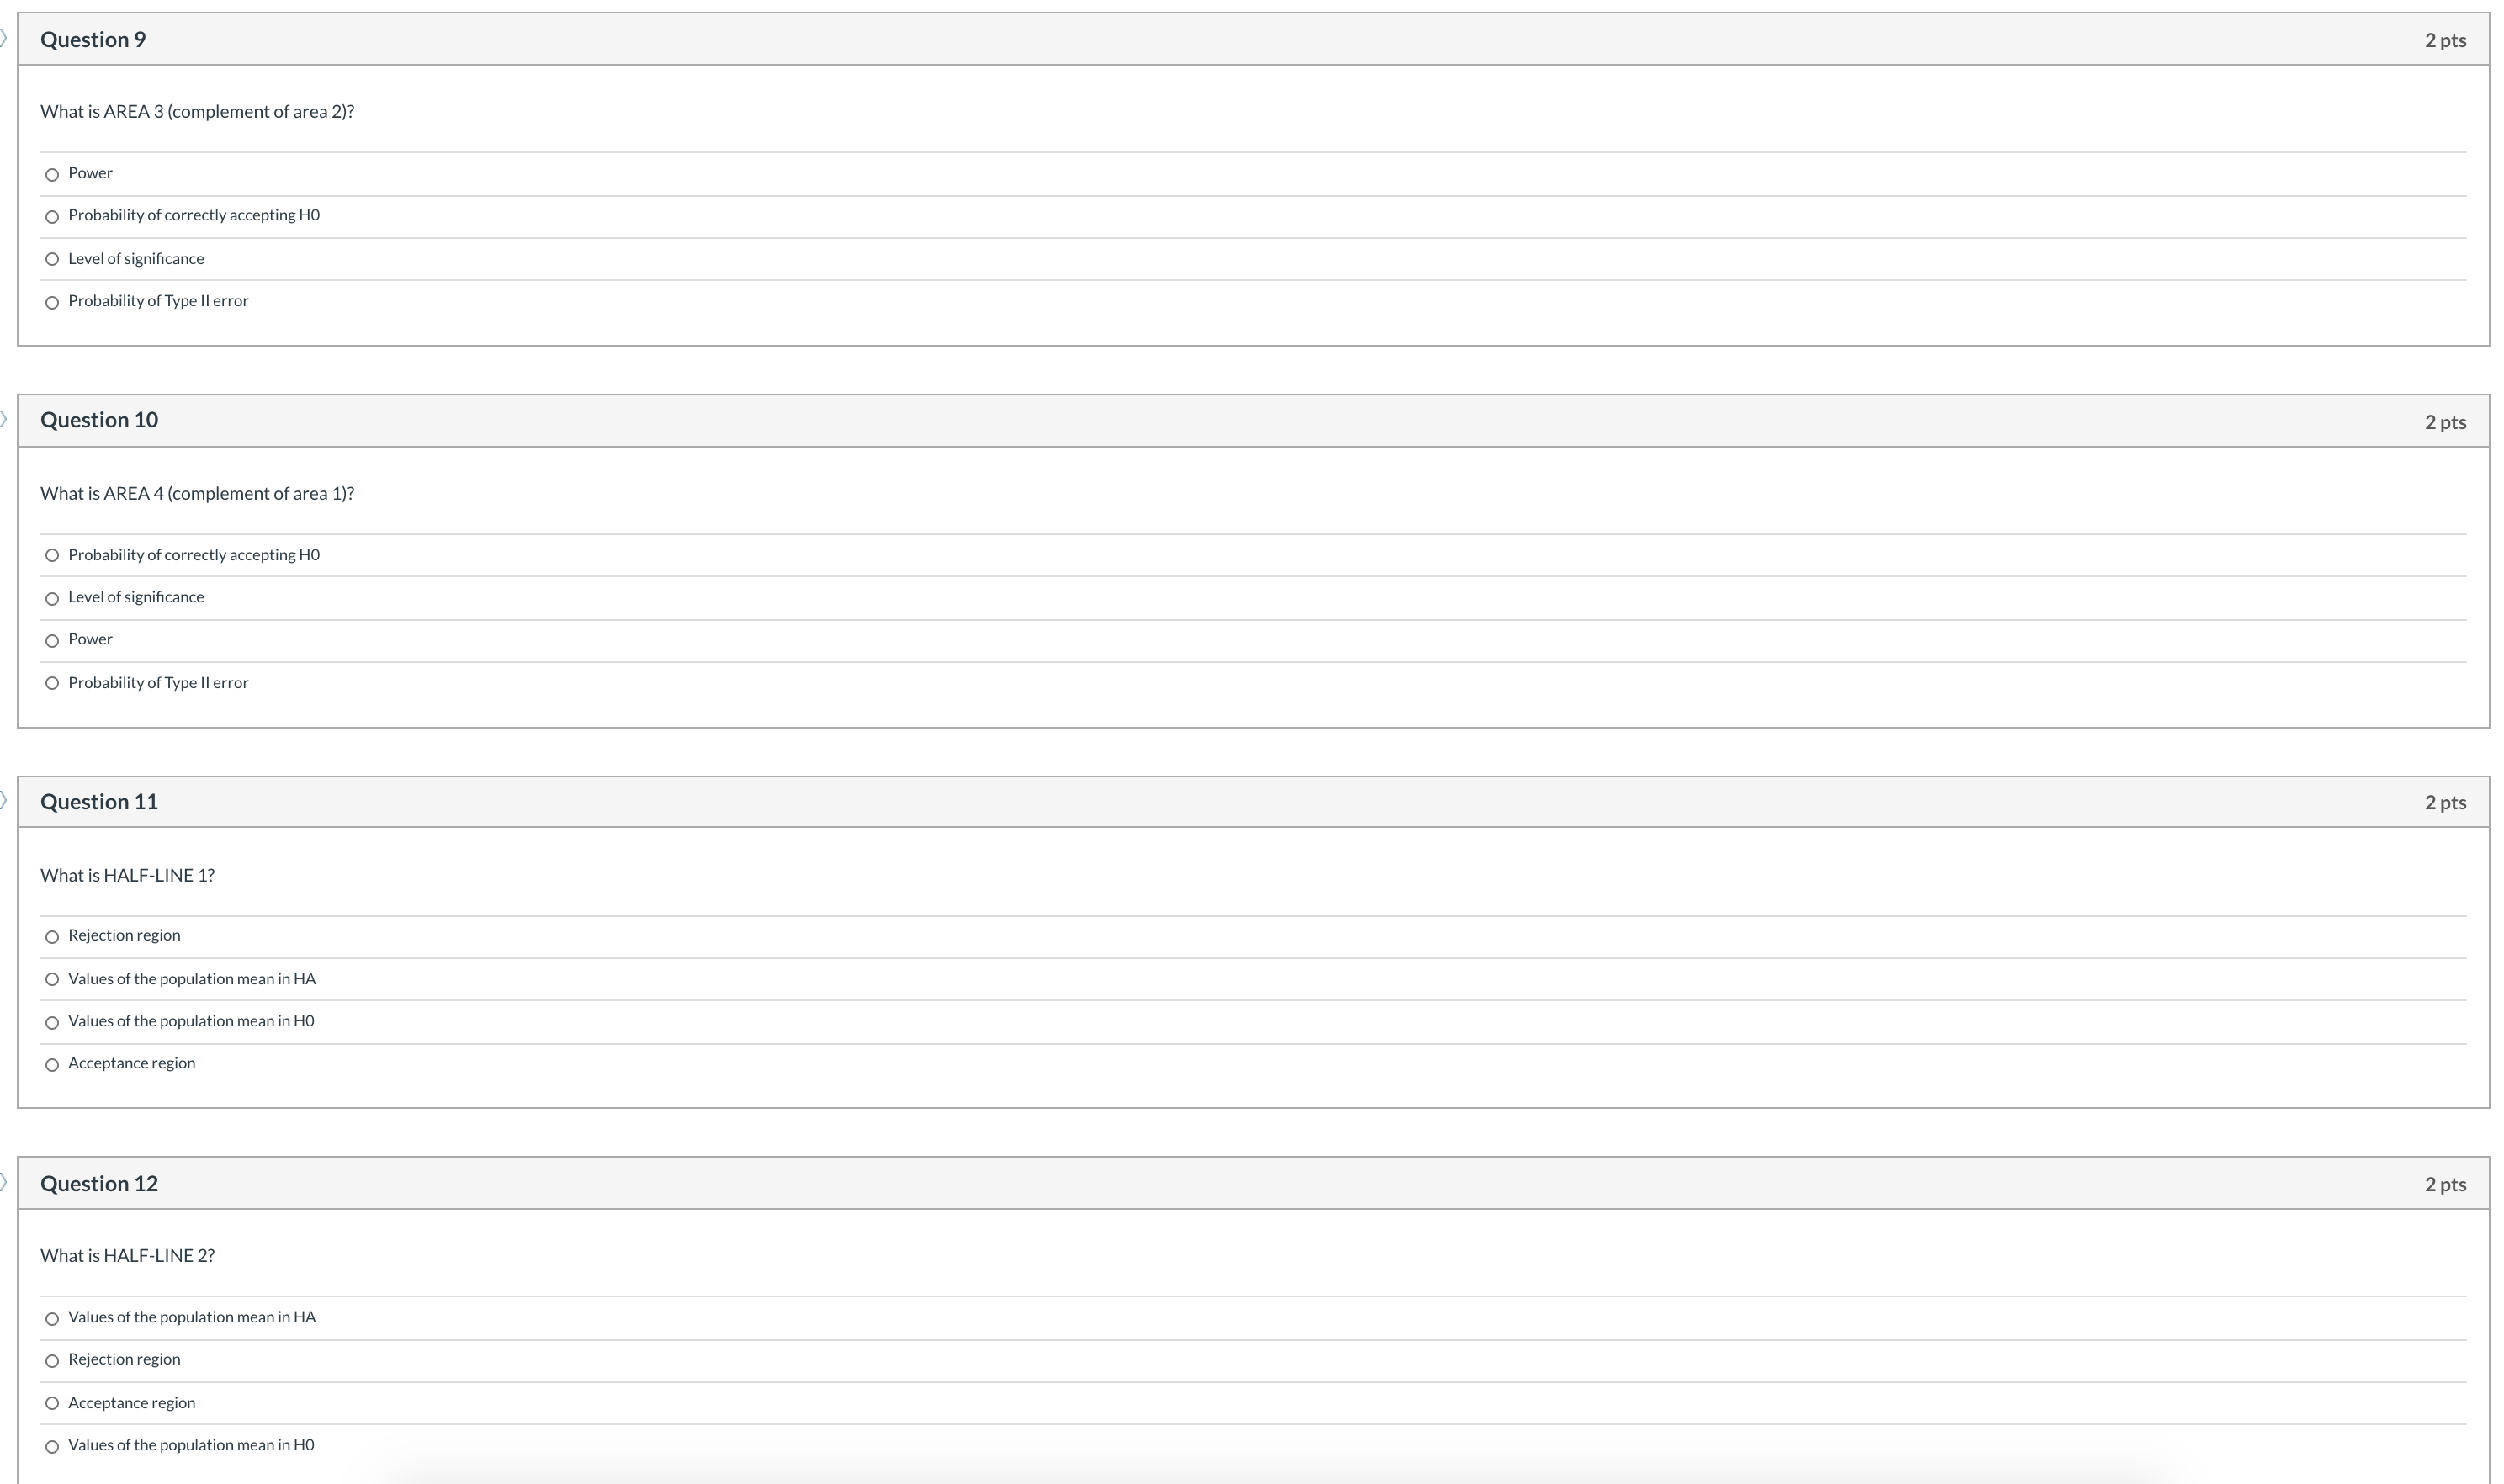
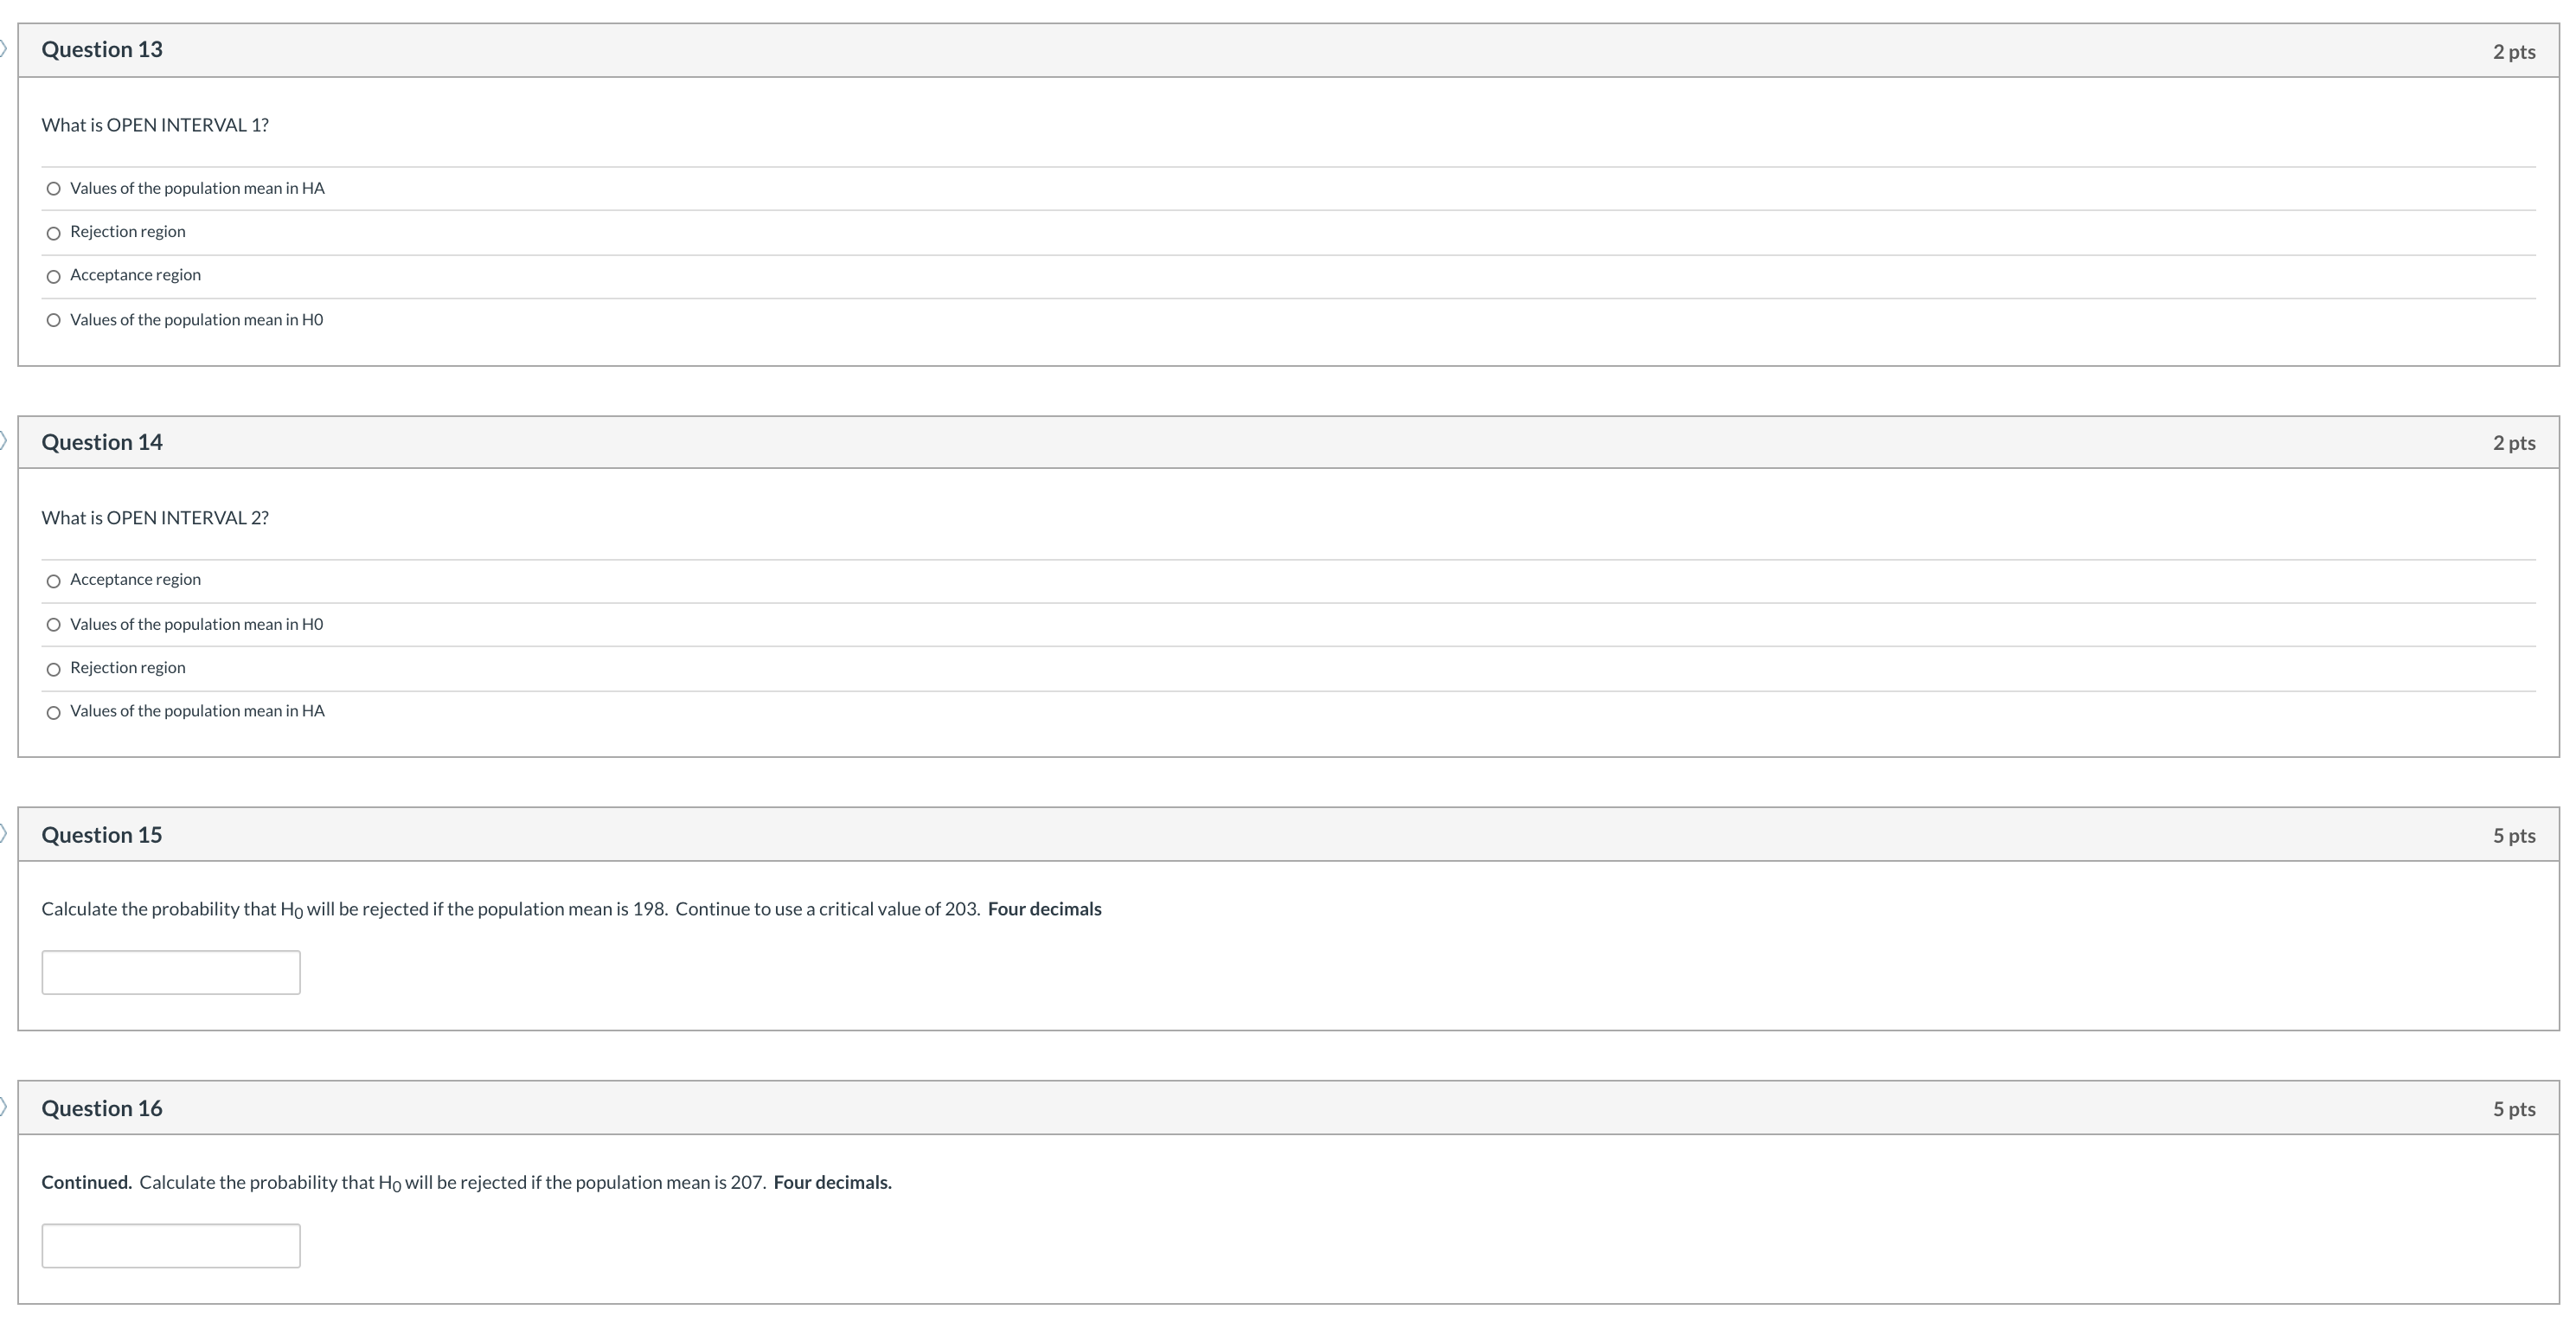
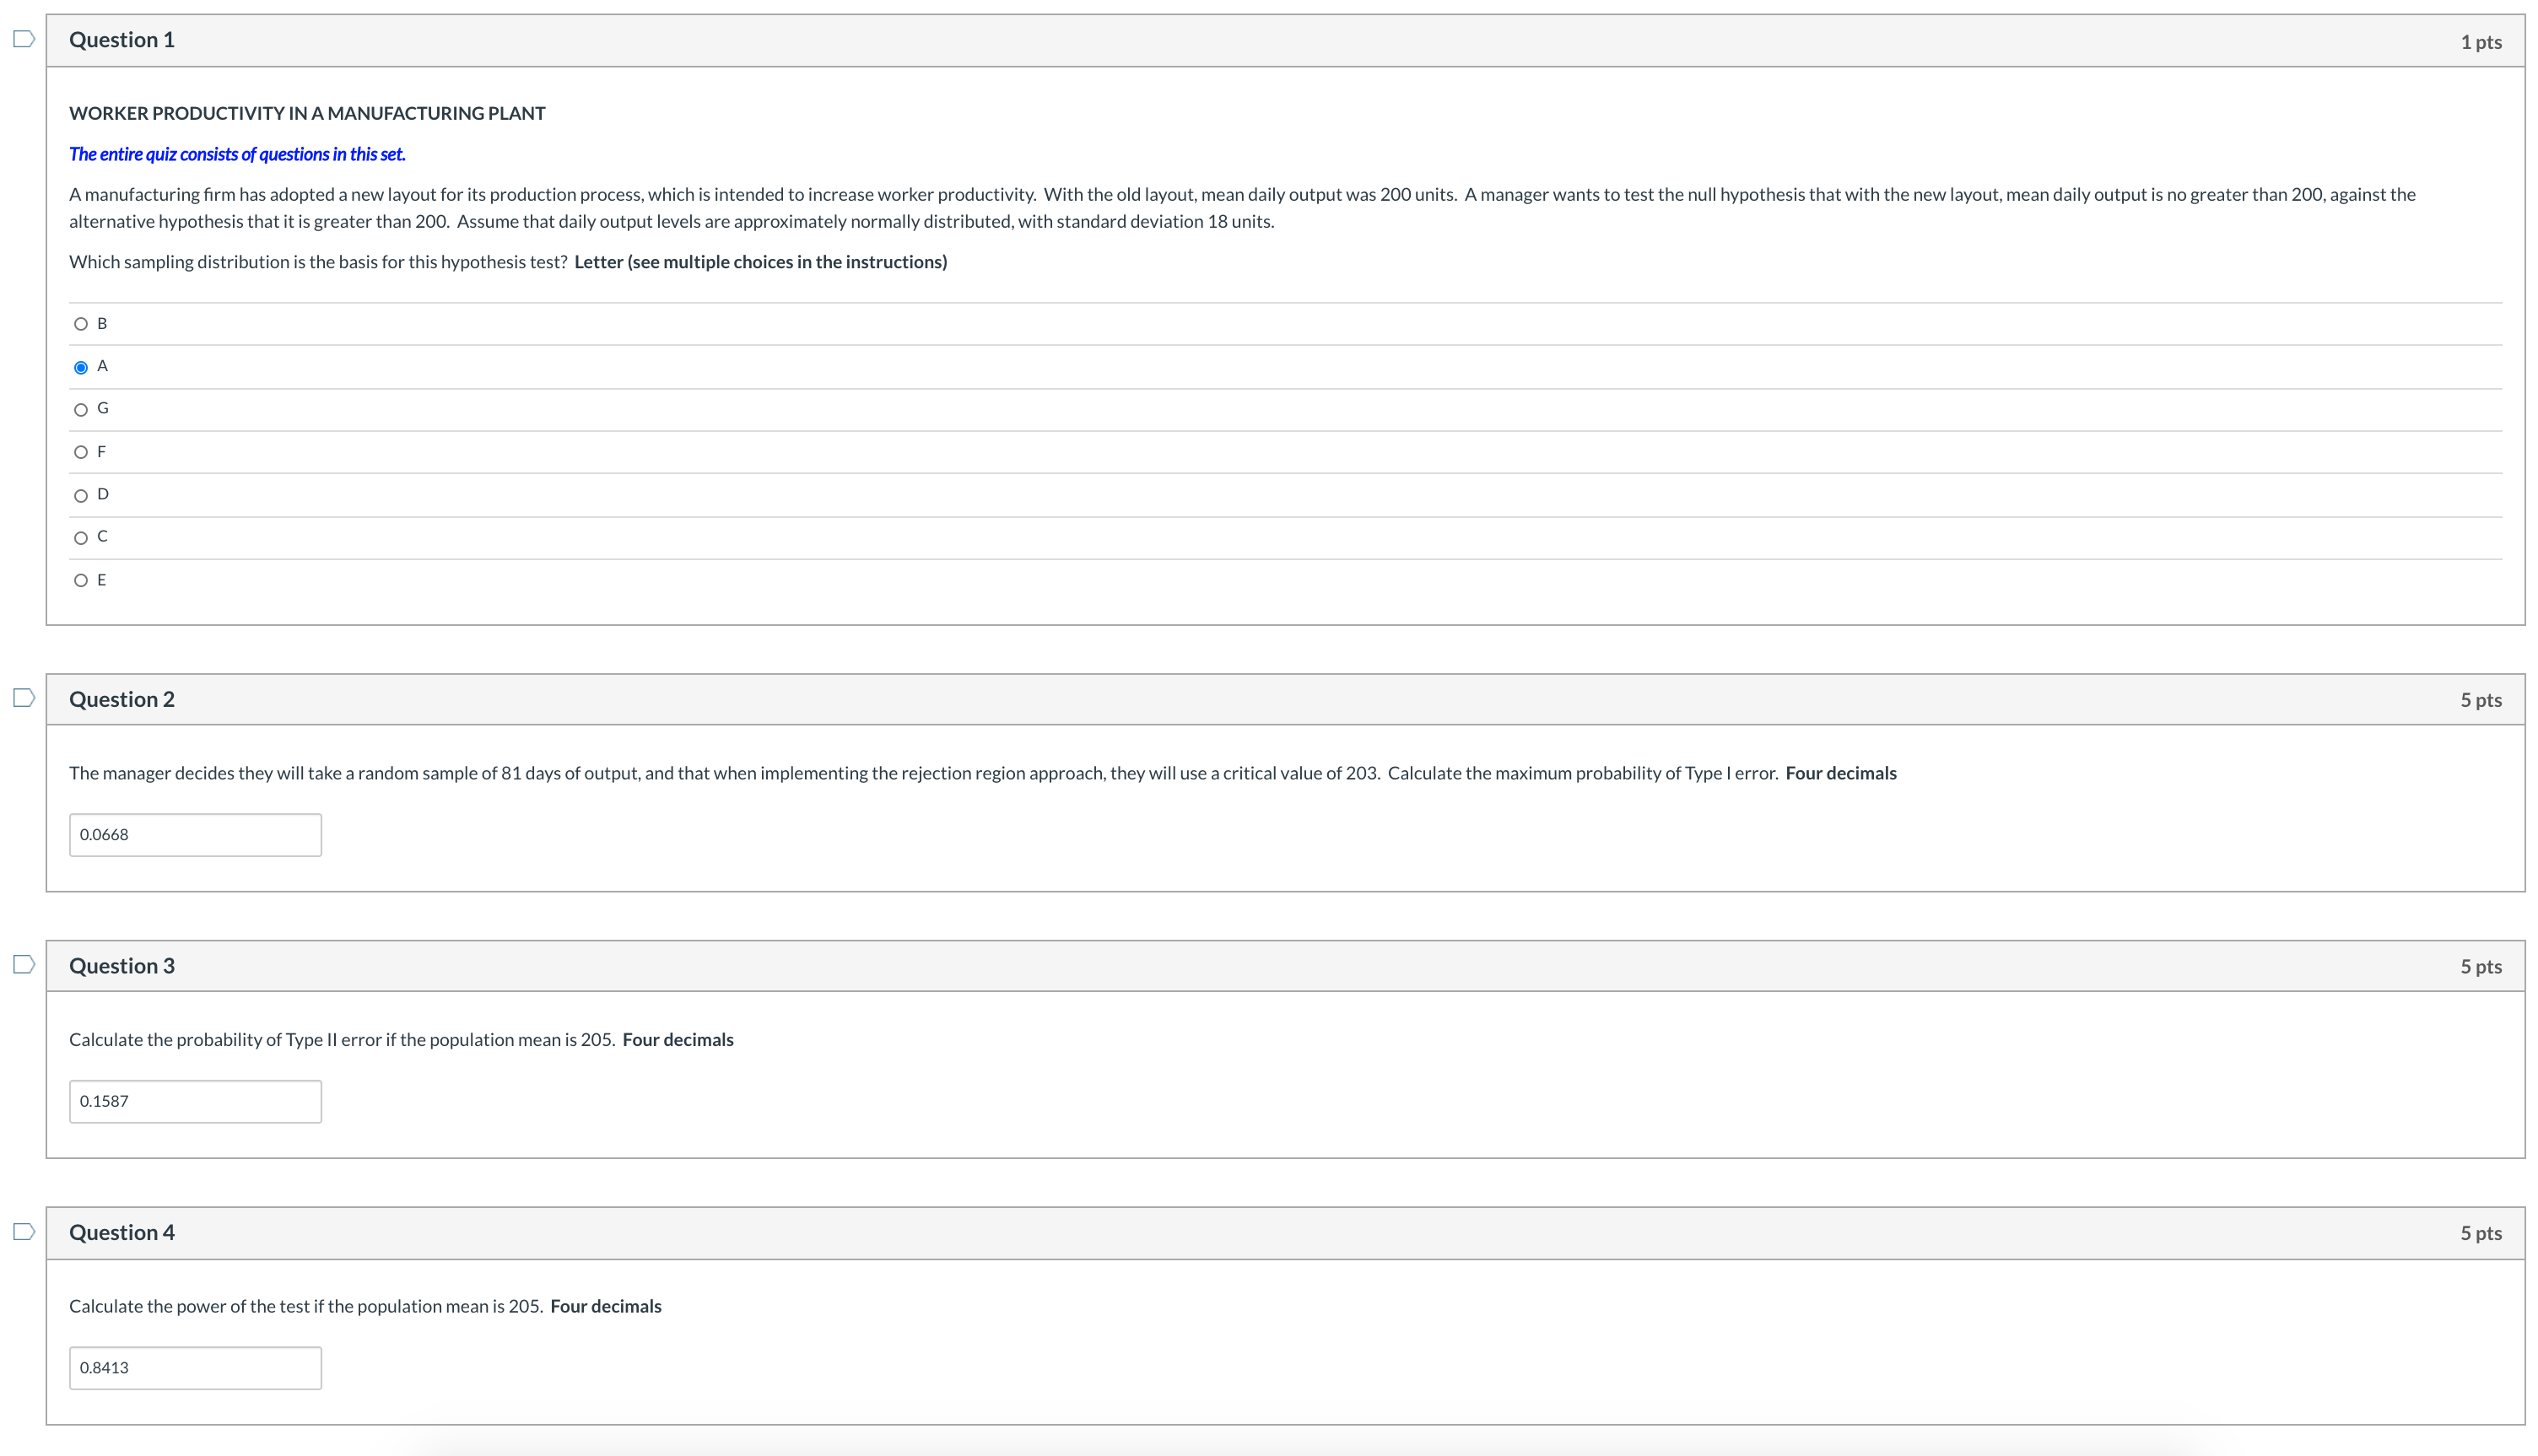
Question 5 2 pts Here is a graph of the hypothesis test in this set of questions. There are 10 questions asking you to label this graph. What is CURVE 1? CURVE 1 CURVE 2 AREA 3 AREA 4 Ho AREA 1 CV HA AREA 2 LL, X HALF-LINE 1 OPEN INVERVAL 1 HALF-LINE 2 OPEN INTERVAL 2CURVE 1 CURVE 2 AREA 3 AREA 4 AREA 1 AREA 2 H, X HALF-LINE 1 OPEN INVERVAL 1 HALF-LINE 2 OPEN INTERVAL 2 O p.d.f. of the sample mean if HO is true O p.d.f. of the sample mean if HA is true Question 6 2 pts What is CURVE 2? O p.d.f. of the sample mean if HO is true O p.d.f. of the sample mean if HA is true Question 7 2 pts What is AREA 1? Level of significance O Probability of Type II error O Power O Probability of correctly accepting HO Question 8 2 pts What is AREA 2? Power O Probability of Type II error O Probability of correctly accepting HO Level of significanceQuestion 9 2 pts What is AREA 3 (complement of area 2)? Power Probability of correctly accepting HO O Level of significance Probability of Type II error Question 10 2 pts What is AREA 4 (complement of area 1)? O Probability of correctly accepting HO Level of significance O Power O Probability of Type II error Question 11 2 pts What is HALF-LINE 1? O Rejection region O Values of the population mean in HA O Values of the population mean in HO O Acceptance region Question 12 2 pts What is HALF-LINE 2? Values of the population mean in HA Rejection region Acceptance region Values of the population mean in HOQuestion 13 2 pts What is OPEN INTERVAL 1? O Values of the population mean in HA O Rejection region O Acceptance region O Values of the population mean in HO Question 14 2 pts What is OPEN INTERVAL 2? O Acceptance region O Values of the population mean in HO O Rejection region Values of the population mean in HA Question 15 5 pts Calculate the probability that Ho will be rejected if the population mean is 198. Continue to use a critical value of 203. Four decimals Question 16 5 pts Continued. Calculate the probability that Ho will be rejected if the population mean is 207. Four decimals.Question 1 1 pts WORKER PRODUCTIVITY IN A MANUFACTURING PLANT The entire quiz consists of questions in this set. A manufacturing firm has adopted a new layout for its production process, which is intended to increase worker productivity. With the old layout, mean daily output was 200 units. A manager wants to test the null hypothesis that with the new layout, mean daily output is no greater than 200, against the alternative hypothesis that it is greater than 200. Assume that daily output levels are approximately normally distributed, with standard deviation 18 units. Which sampling distribution is the basis for this hypothesis test? Letter (see multiple choices in the instructions) O B OA OG OF OD OE Question 2 5 pts The manager decides they will take a random sample of 81 days of output, and that when implementing the rejection region approach, they will use a critical value of 203. Calculate the maximum probability of Type | error. Four decimals 0.0668 D Question 3 5 pts Calculate the probability of Type II error if the population mean is 205. Four decimals 0.1587 D Question 4 5 pts Calculate the power of the test if the population mean is 205. Four decimals 0.8413
Step by Step Solution
There are 3 Steps involved in it

Get step-by-step solutions from verified subject matter experts