

Question: need help with A and B with work shown please ! Problem 3 A southern public university wants to forecast the enrollment in its business
need help with A and B with work shown please ! 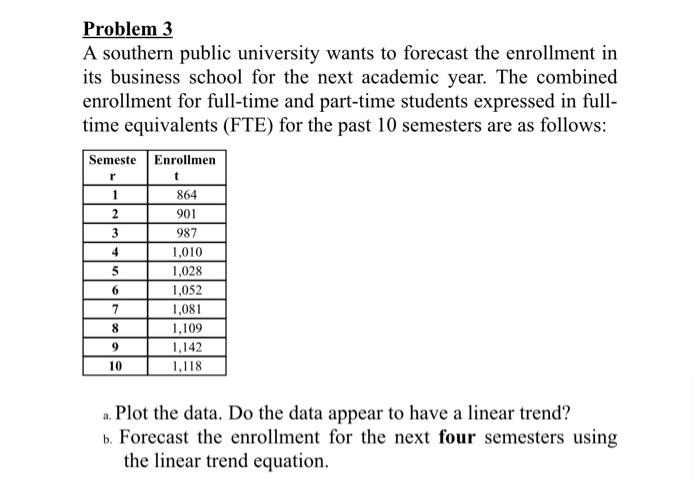
Problem 3 A southern public university wants to forecast the enrollment in its business school for the next academic year. The combined enrollment for full-time and part-time students expressed in full- time equivalents (FTE) for the past 10 semesters are as follows: Semeste Enrollmen r t 864 901 987 1,010 1,028 1,052 7 1,081 8 1,109 9 1,142 10 1,118 a. Plot the data. Do the data appear to have a linear trend? b. Forecast the enrollment for the next fo semesters using the linear trend equation. 1 2 3 4 5 6 Step by Step Solution
There are 3 Steps involved in it
1 Expert Approved Answer
Step: 1 Unlock

Question Has Been Solved by an Expert!
Get step-by-step solutions from verified subject matter experts
Step: 2 Unlock
Step: 3 Unlock