

Question: Need help with a and bThanks! Using Data Analytics to Compare Companies' Profitability Caterpillar is a manufacturer of construction and mining equipment, diesel and natural
Need help with a and bThanks!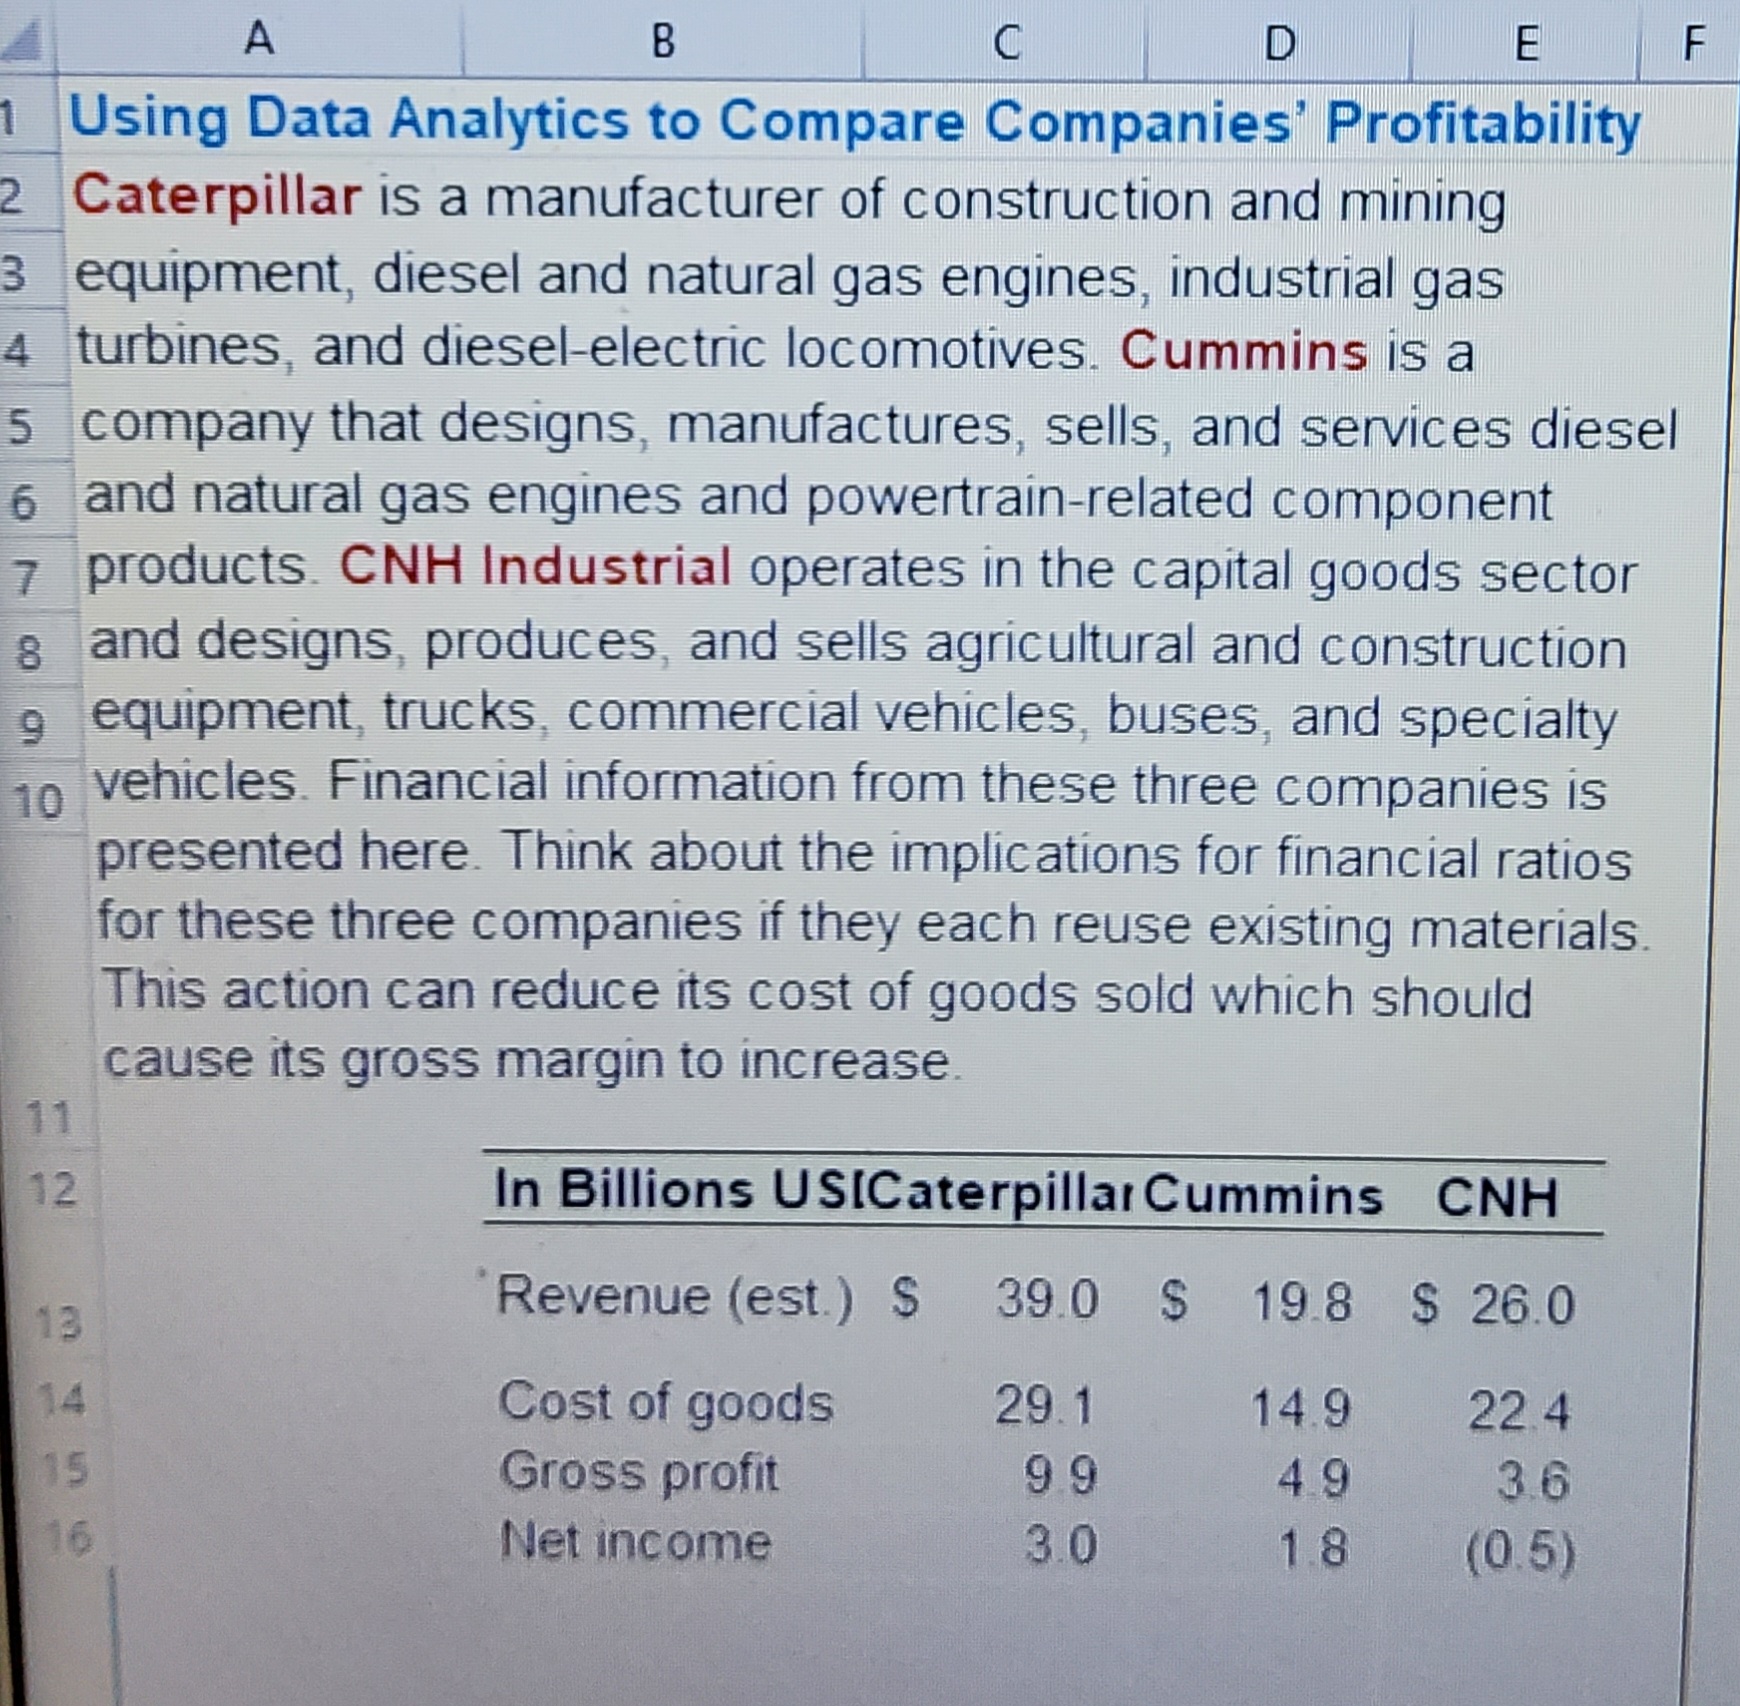
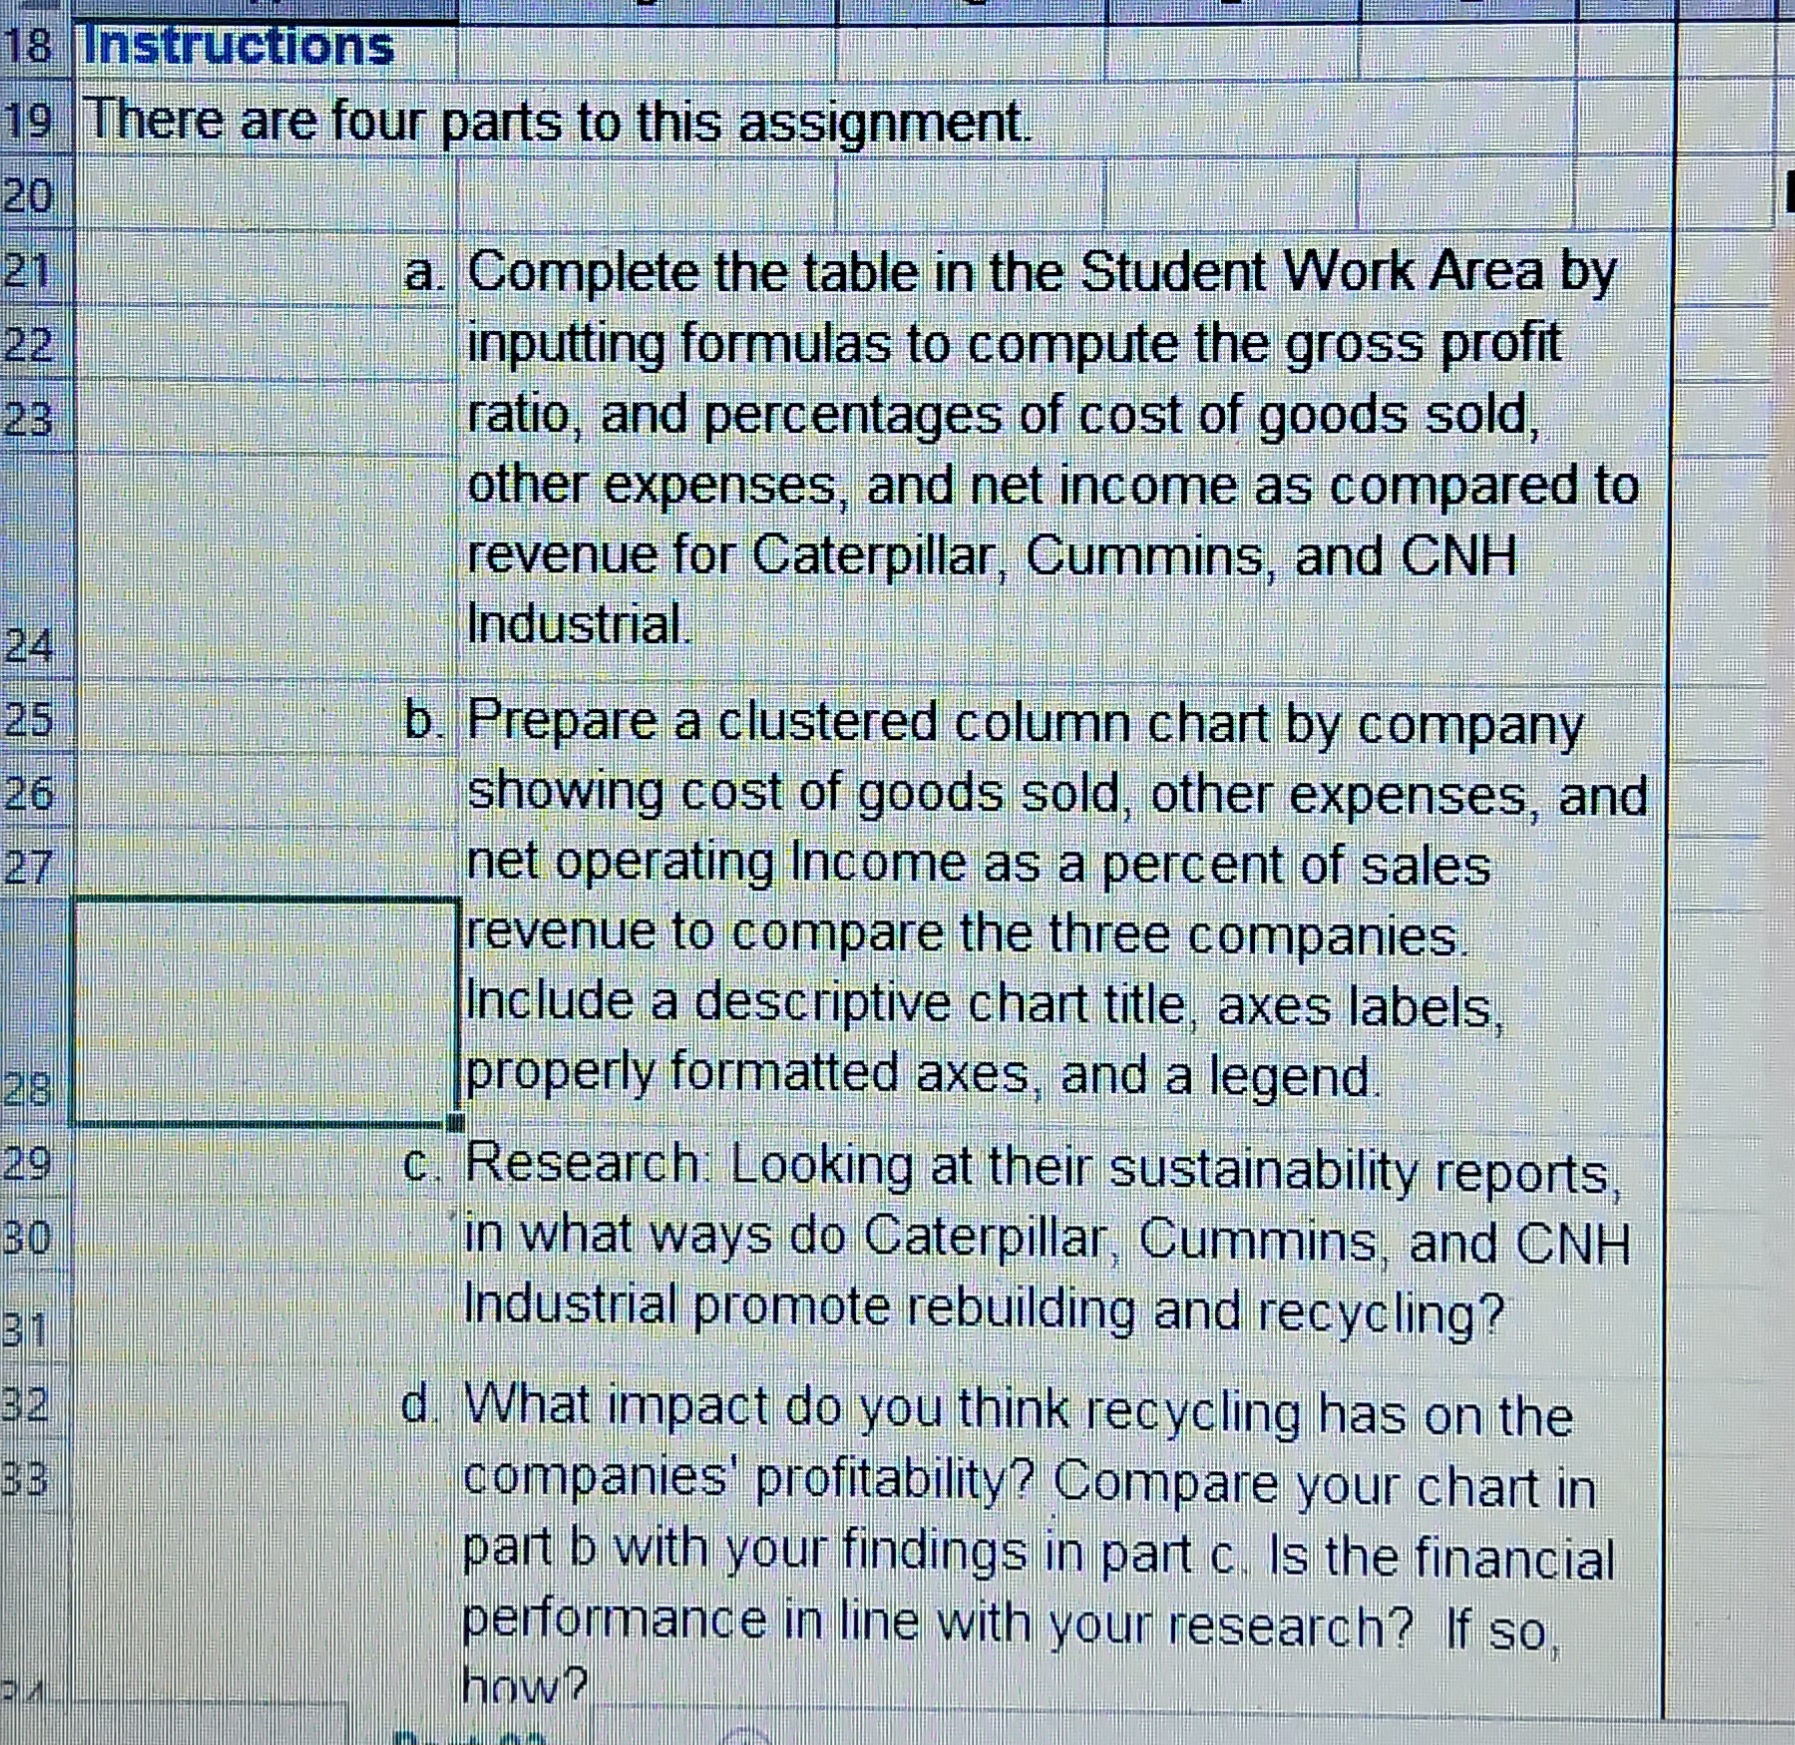
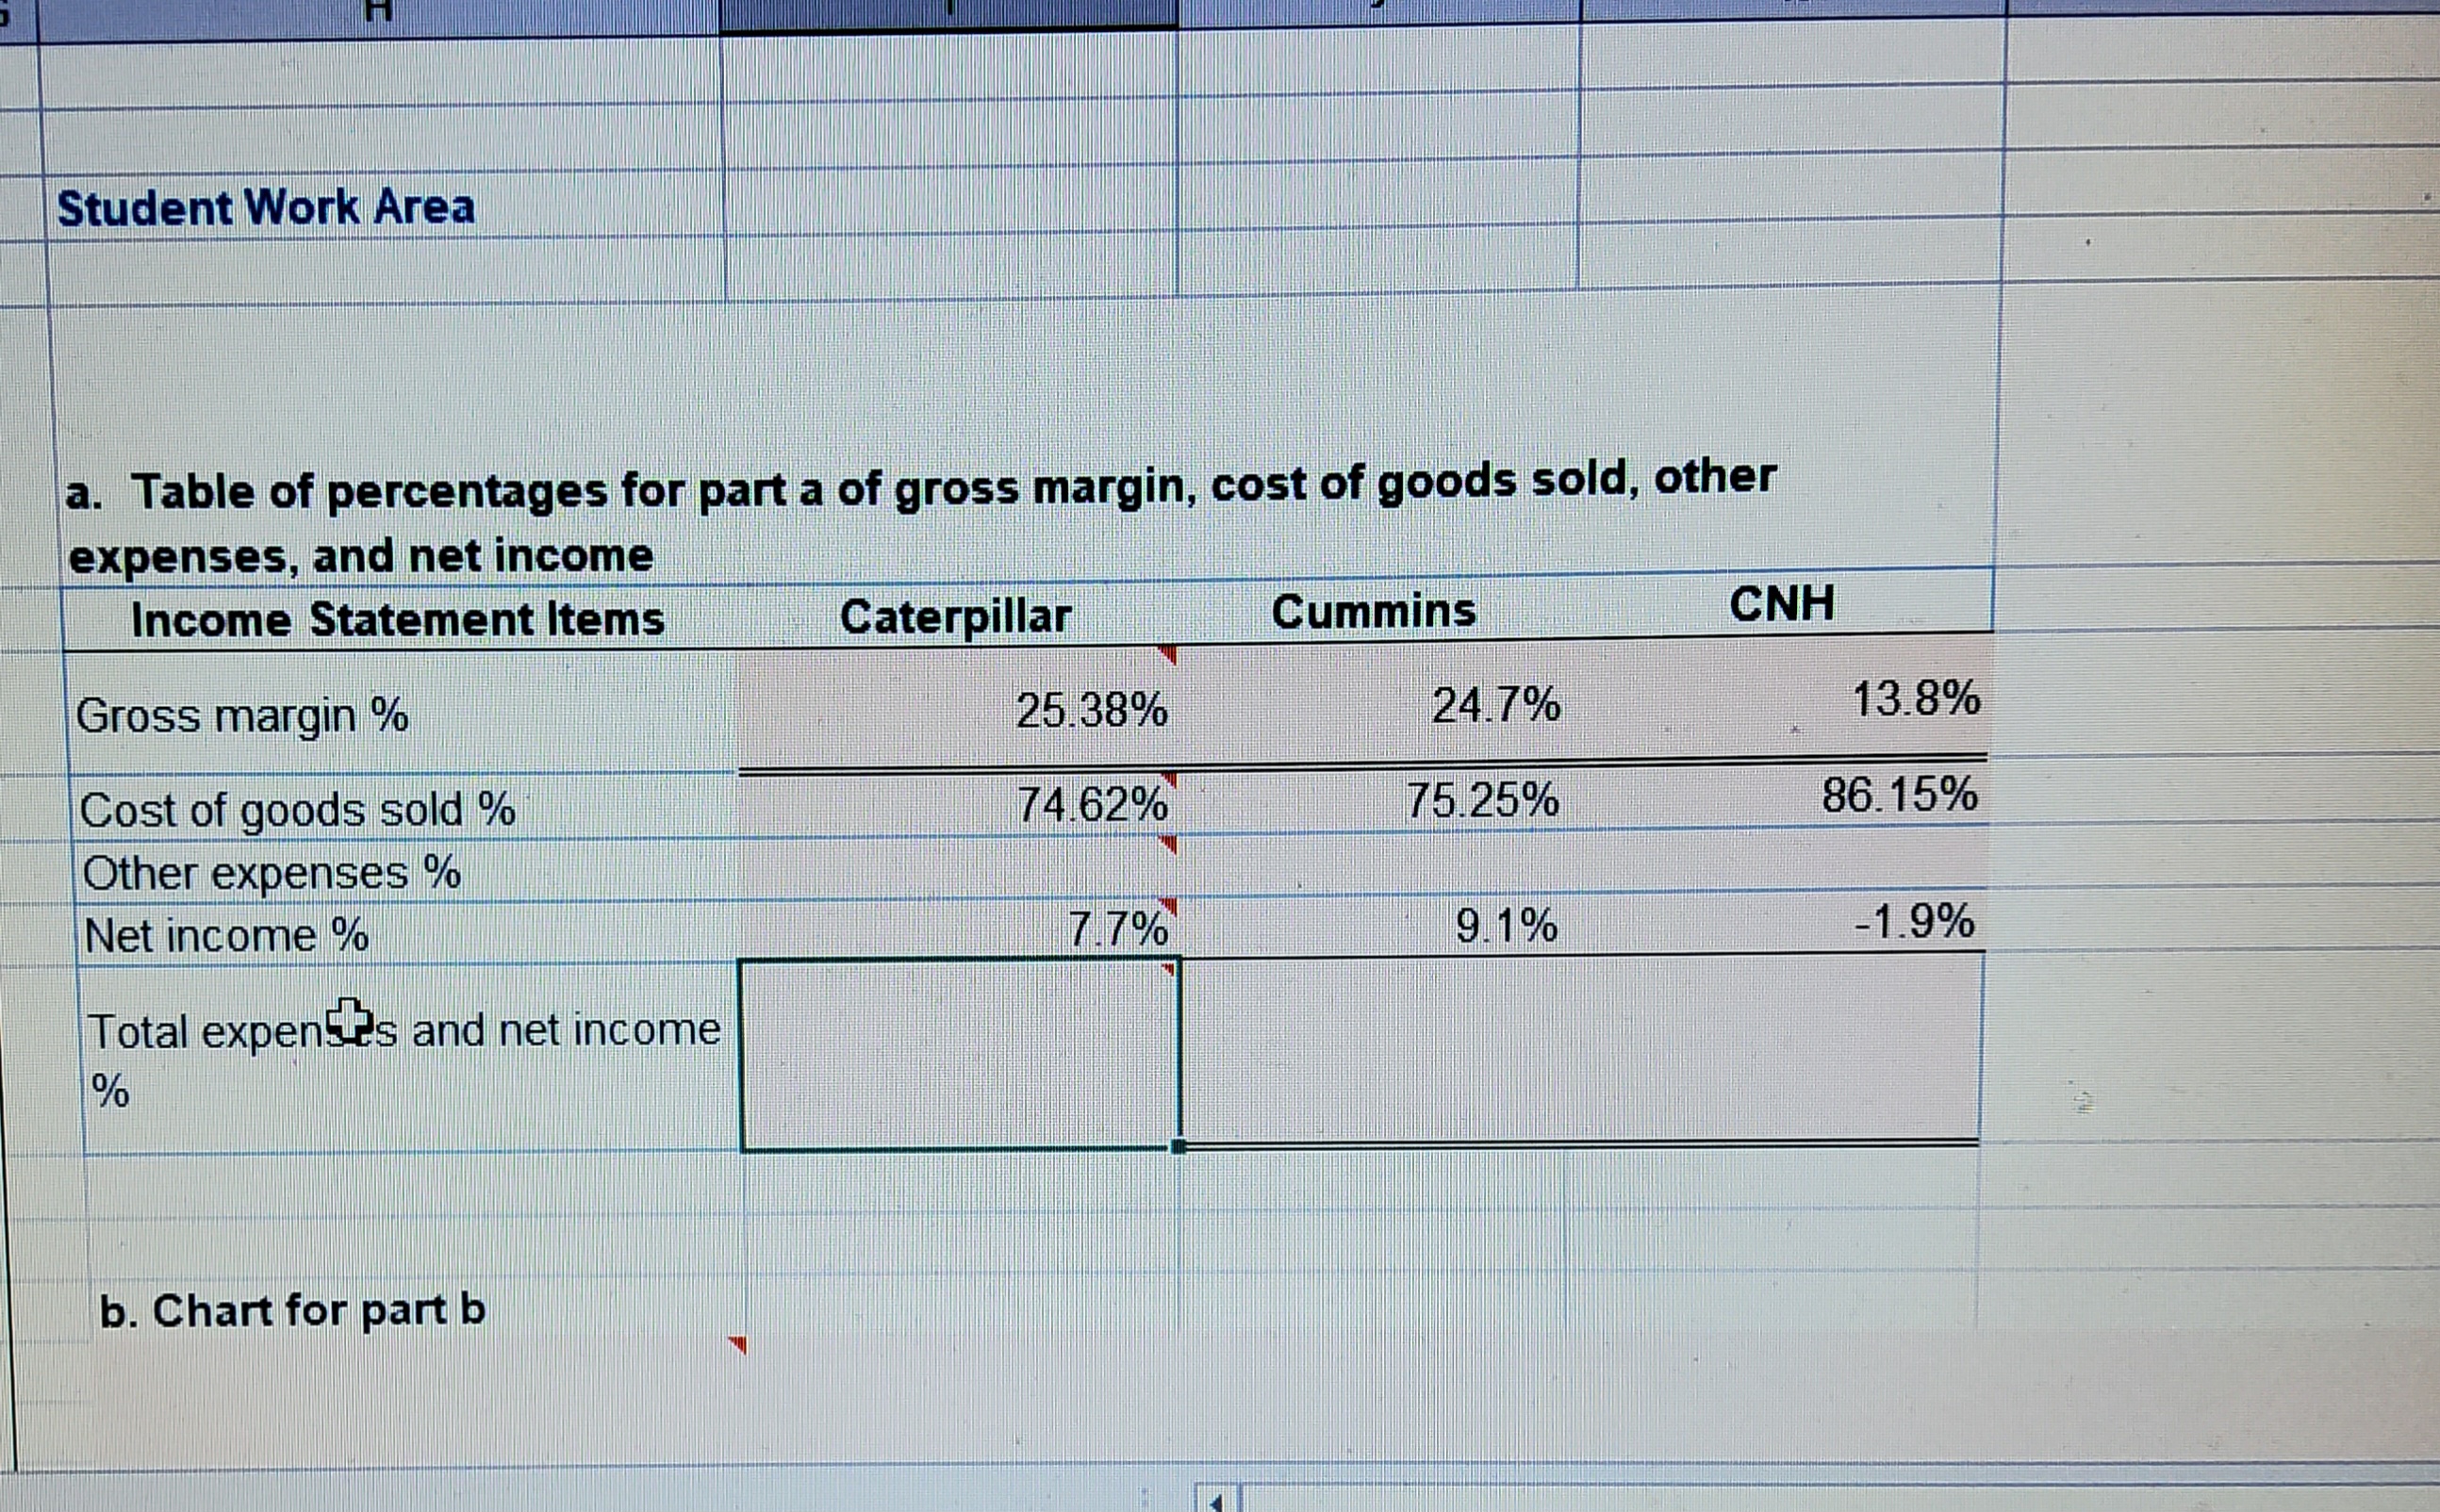
Using Data Analytics to Compare Companies' Profitability Caterpillar is a manufacturer of construction and mining equipment, diesel and natural gas engines, industrial gas turbines, and diesel-electric locomotives. Cummins is a company that designs, manufactures, sells, and services diesel and natural gas engines and powertrain-related component products. CNH Industrial operates in the capital goods sector and designs, produces, and sells agricultural and construction equipment, trucks, commercial vehicles, buses, and specialty vehicles. Financial information from these three companies is presented here. Think about the implications for financial ratios for these three companies if they each reuse existing materials. This action can reduce its cost of goods sold which should cause its gross margin to increase. parts to this assignment. a. Complete the table in the Student Work Area by inputting formulas to compute the gross profit ratio, and percentages of cost of goods sold, other expenses, and net income as compared to revenue for Caterpillar, Cummins, and CNH Industrial. b. Prepare a clustered column chart by company showing cost of goods sold, other expenses, and net operating Income as a percent of sales revenue to compare the three companies. Include a descriptive chart title, axes labels, properly formatted axes, and a legend. c. Research: Looking at their sustainability reports, in what ways do Caterpillar, Cummins, and CNH Industrial promote rebuilding and recycling? d. What impact do you think recycling has on the companies' profitability? Compare your chart in part b with your findings in part c. Is the financial performance in line with your research? If so, how? a. Table of percentages for part a of gross margin, cost of goods sold, other
Step by Step Solution
There are 3 Steps involved in it

Get step-by-step solutions from verified subject matter experts