

Question: Need help with A - f Part4) R - 30 points Initialize the Dow Jones Industrials daily closing data, dow, using the read.csv function with
Need help with A - f
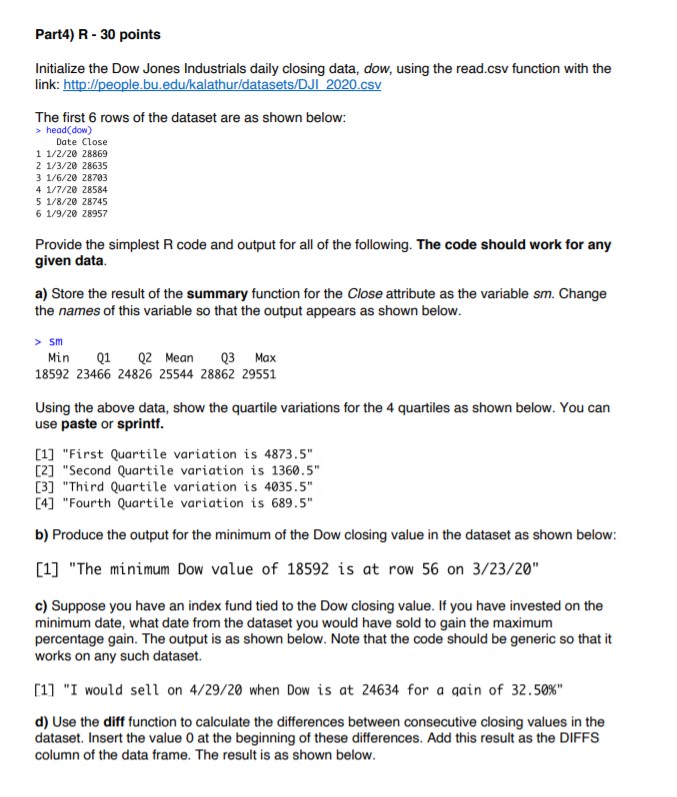
Part4) R - 30 points Initialize the Dow Jones Industrials daily closing data, dow, using the read.csv function with the link: http://people.bu.edu/kalathur/datasets/DJI 2020.csv The first 6 rows of the dataset are as shown below: > head(dow) Date Close 1 1/2/20 28869 2 1/3/20 28635 3 1/6/20 28703 4 1/7/20 28584 5 1/8/20 28745 6 1/9/20 28957 Provide the simplest R code and output for all of the following. The code should work for any given data. a) Store the result of the summary function for the Close attribute as the variable sm. Change the names of this variable so that the output appears as shown below. > sm Min Q1 Q2 Mean Q3 Max 18592 23466 24826 25544 28862 29551 Using the above data, show the quartile variations for the 4 quartiles as shown below. You can use paste or sprintf. [1] "First Quartile variation is 4873.5" [2] "Second Quartile variation is 1360.5" [3] "Third Quartile variation is 4035.5" [4] "Fourth Quartile variation is 689.5" b) Produce the output for the minimum of the Dow closing value in the dataset as shown below: [1] "The minimum Dow value of 18592 is at row 56 on 3/23/20" c) Suppose you have an index fund tied to the Dow closing value. If you have invested on the minimum date, what date from the dataset you would have sold to gain the maximum percentage gain. The output is as shown below. Note that the code should be generic so that it works on any such dataset. [1] "I would sell on 4/29/20 when Dow is at 24634 for a gain of 32.50%" d) Use the diff function to calculate the differences between consecutive closing values in the dataset. Insert the value 0 at the beginning of these differences. Add this result as the DIFFS column of the data frame. The result is as shown below
Step by Step Solution
There are 3 Steps involved in it

Get step-by-step solutions from verified subject matter experts